Are any ASX sectors showing their hand? (ORA, PNV, CUV)
The ASX200 closed unchanged yesterday after trading in an extremely choppy 49-point range, we threatened to both soar & plunge twice during the day as news / rumours filtered across the newswires prior to the US – China trade talks. Although we actually closed the day marginally in the green over 40% more stocks closed down on the day while none of the 11 sectors managing to close up or down by greater than 0.5%, in other words we have an extremely uncommitted market that’s balancing on the gymnastics beam, unsure whether to move to a bullish or bearish stance.
The investment community has been focused very closely on US – China trade for many weeks with the talks current likely to dictate market sentiment into Christmas. Hopes are improving that a mini deal will be achieved that can eventually become the platform for a more meaningful outcome in the future. However with lots of testosterone in the room it’s a coin toss in our opinion especially considering the wild mood swings regularly exhibited by the US President – Trump undoubtedly would like a euphoric style resolution to help his re-election campaign but the sceptic in me postulates it’s perhaps too early for the greatest impact.
The $A caught my eye at 6am this morning after it quietly rallied over +0.5%, Australia may be in an aggressive rate cutting cycle but this is understood and markets look forward, not back. Surprisingly to many the $A is now up for October – watch this space MM remains bullish the $A, a contrarian view that might see some noticeable underperformance from $US earning stocks on the ASX if they see their multi-year tailwind reverse to a headwind.
Short-term MM remains comfortable adopting a more conservative stance towards equities.
Overnight global stocks rallied on optimism of a partial deal from Washington’s trade talks between the US and China, the Dow out on 150-points helping the SPI futures rally 42-points with BHP looking likely to add strong support to the ASX after it rallied over 2% in the US following strength in crude oil, copper and iron ore. President Trump has stated that the Day 1 trade talks went very well which has helped early morning sentiment but will he maintain this consistent theme?
This morning MM has looked at 5 ASX sectors as the value v growth argument gathers momentum.
ASX200 Chart
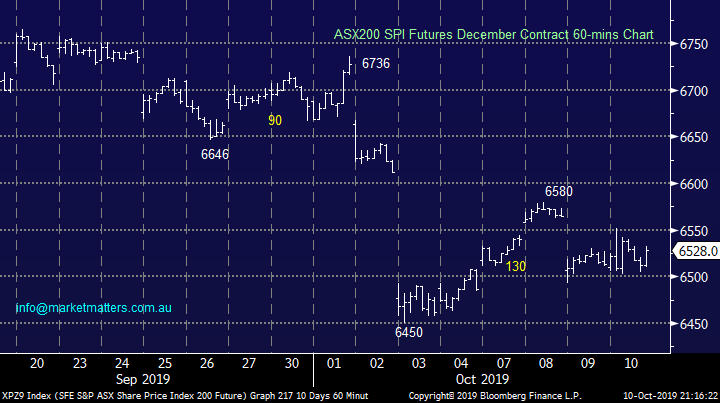
Often the best indicator for the short-term direction of the ASX200 is provided by the SPI futures because they are the vehicle which fund managers and traders regularly use to increase / decrease their market weight before deciding exactly what sectors / stocks they want to buy & sell. Over the last week the SPI has traded in a relatively tight 130-points range which we call a neutral pattern as the majority of the activity is occurring around the mid-point of the range – this represents a normal distribution of activity for the mathematicians out there. This market set up provides MM with 2 excellent risk / reward “trading & investing” opportunities:
1 A breakdown below 6450 followed to a rally back above 6470 generates an excellent “buy signal”.
2 A breakout above 6580 followed by a reversal back under 6560 generates an excellent “sell signal”.
A few traders I know simply sit back and wait for such solid risk / reward opportunities without getting whipsawed by the choppy price action in the middle – this would certainly have made sense yesterday!
NB For more details on the SPI go to : https://www.asx.com.au/products/index-derivatives/asx-index-futures-contract-specifications.htm
ASx200 SPI Futures December Contract Chart
On a quiet index Thursday 3 stocks in the ASX200 managed to move by well over 10%, certainly worth a quick closer look:
1 Orora (ORA) +13.9% - The packaging business soared after selling its packaging unit to Japans Nippon Paper for $1.7bn, the sale appears to be an excellent result for ORA and the share move reflected this interpretation. However if the whole company was to be valued on the same multiple of the sale ORA would trade another 8-10% higher not particularly exciting in our opinion.
Hence MM is neutral / to mildly bullish ORA at present.
We prefer our deep value holding in Pact Group (PGH) which is currently trading on a valuation over 40% lower than that of ORA.
Orora (ORA) Chart
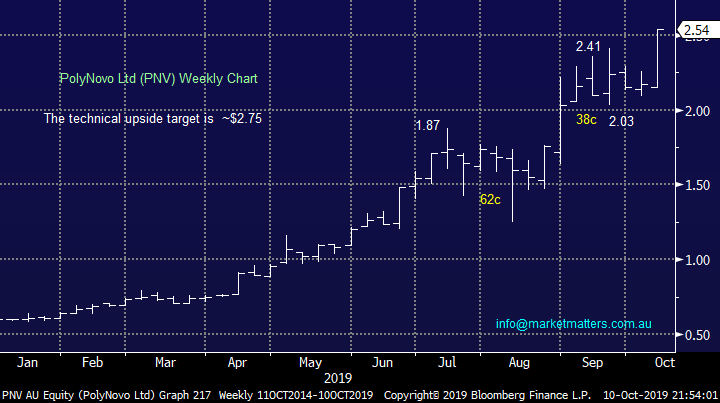
2 PolyNovo Ltd (PNV) +11.9% - biotech stock PNV surged to fresh all-time highs yesterday without any major news. This is still a loss making business but the markets clearly voting with both feet that its patented polymer technology NovoSorb is going to pay dividends down the track. We find it very hard to get excited about this business which is currently now valued at $1.68bn but its still losing money i.e. there’s a lot of optimism built into its current share price.
MM is neutral PNV at current levels.
PolyNovo Ltd (PNV) Chart
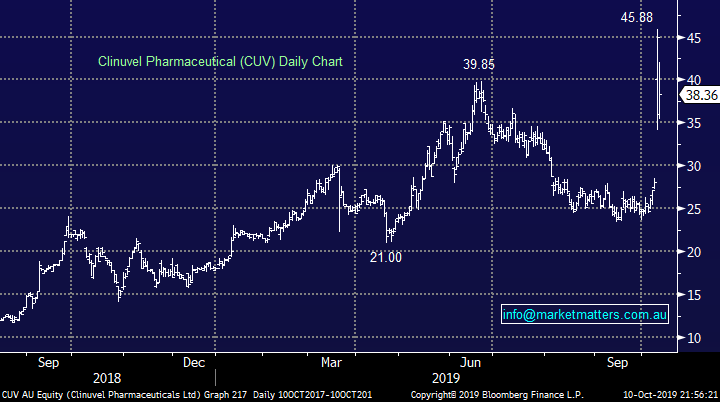
3 Clinuvel Pharmaceutical (CUV) -14.8% - this Melbourne based biopharma business saw its shares fall almost 15% yesterday but they’ve still soared this month taking the companies valuation to $1.9bn. The fall appears to be simply attributable to profit taking after the amazing gains on Wednesday, following the FDA approval of its SCENESSE for the treatment of EPP in adults.
MM is neutral CUV at current levels.
Clinuvel Pharmaceutical (CUV) Chart
Running the ruler over 5 different ASX200 sectors.
The growth or value discussion has been gaining momentum over recent weeks including our own piece which concluded with “it’s very close to being time to move back from growth to value”. However without repeating much of our previous discussion we felt today would be an opportune time to evaluate a few specific sectors as the US – China trade talks look likely to give us some direction on the global economy and trade potential, at least short-term.
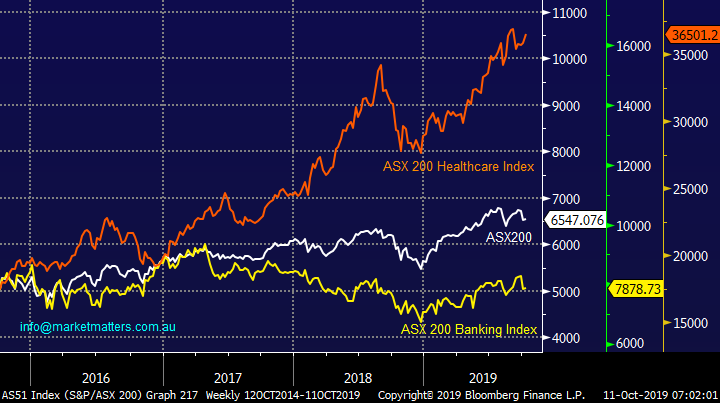
The chart below illustrates perfectly the tremendous advantage investors can enjoy when they place their hard earned money in sectors which outperform e.g. over the last few years before dividends the Healthcare sector has clearly significantly outperformed both the ASX200 and its heavyweight Banking index. Obviously there have been a number of reasons behind this outperformance but plunging bond yields has created a huge tailwind for growth stocks like Healthcare and IT.
The relative performance gap between growth and value is trading around historical extremes and the strong likelihood is we will see an aggressive reversion at some time in the future, but when is the million dollar question. Last month we saw one week when the switch button appeared to be pressed in earnest and rotation was huge and aggressive, we believe that was a warning for what’s to come in the relatively near future.
The ASX200, Healthcare & Banking Indices Chart
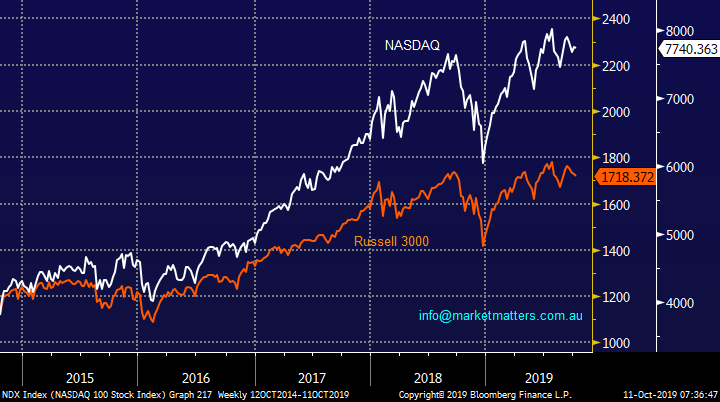
When we look at the relative performance of major US indices it’s also clear to see the growth based NASDAQ has significantly outperformed the broad Russell 3000, at MM we again believe this relative performance is very close to reversing.
The NASDAQ v Russell 3000 Chart
Hence today we have looked at 5 market sectors for signs we should be buying or avoiding stocks under their umbrella moving forward – we plan to look at another 5 sectors in the week ahead.
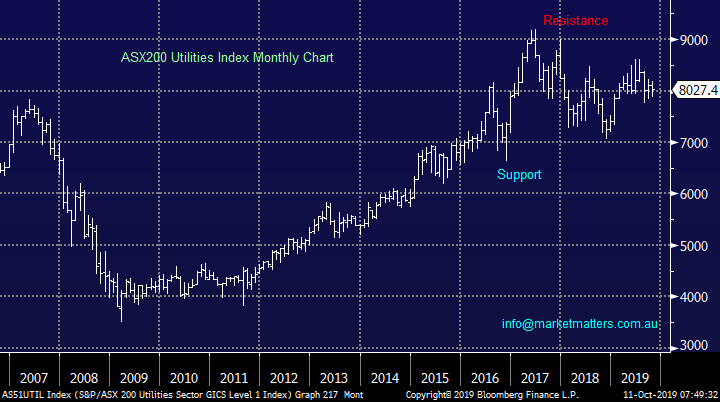
1 ASX200 Utilities Index
The Utilities Sector is regarded as a classic yield play yet ironically its actually fallen from its 2017 high – stocks in the sector include AGL Ltd, APA Group, Spark Infrastructure and Ausnet Services. As a group the sectors paying a 12-month 5.4% yield but its struggled to perform compared to the likes of Transurban (TCL) and Sydney Airports (SYD) in the Transport Sector. At this stage we would be buyers and sellers +/- 15% from current levels i.e. it’s very uninteresting to MM at present.
MM is neutral the Australian Utilities sector.
ASX200 Utilities Index Chart
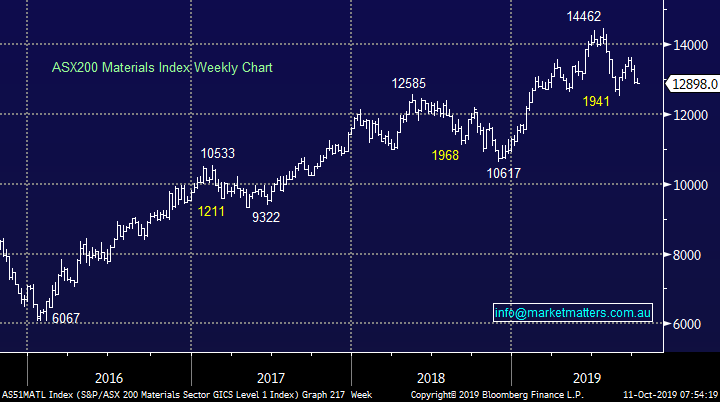
2 ASX200 Materials Index
The Materials (Resources) Index is a huge group within the ASX200 with a market cap of $330bn, its headed by the likes of the BHP Group and RIO Tinto. At MM we have been looking to increase our exposure to the resources sector moving forward as we anticipate global stimulus to come back with a bang as rate cuts fail to underpin decent growth .
Technically its tricky here with strong support around 11,000 and 15,000 feeling a sell zone if its reached in 2020.
MM is mildly positive the Materials index at present.
ASX200 Materials Index Chart
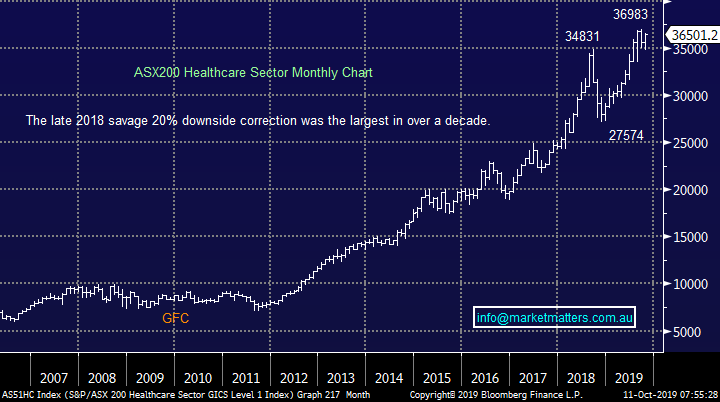
3 ASX200 Healthcare Index
The in vogue Healthcare Index looks strong in the short-term and fresh all-time highs feel inevitable however the risk / reward is not compelling at current levels. We can still envisage a test of Q4 2018 panic lows hence we are happier sitting on the fence at this point in time.
MM is neutral the Healthcare sector from a risk / reward perspective.
ASX200 Healthcare Index Chart
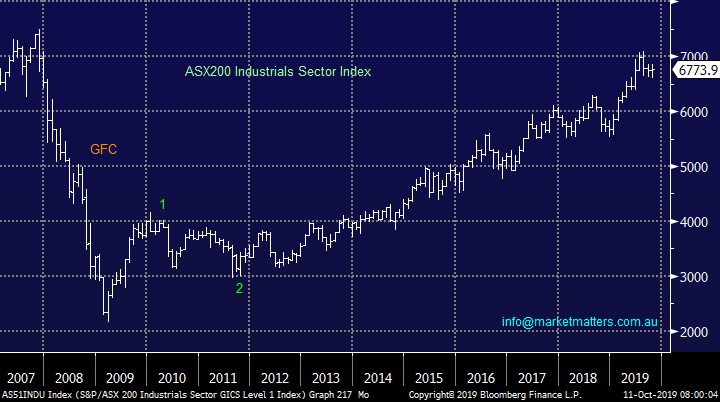
4 ASX200 Industrials Index
The local Industrials Index feels a little tired although there is no reason to assume that the 8-year bull advance from 2011 is going to fail – stocks in this large sector include Brambles (BXB), Seek (SEK), Bingo (BIN), CIMIC (CIM) and Transurban (TCL).
MM is neutral the Australian Industrials.
ASX200 Industrials Index Chart
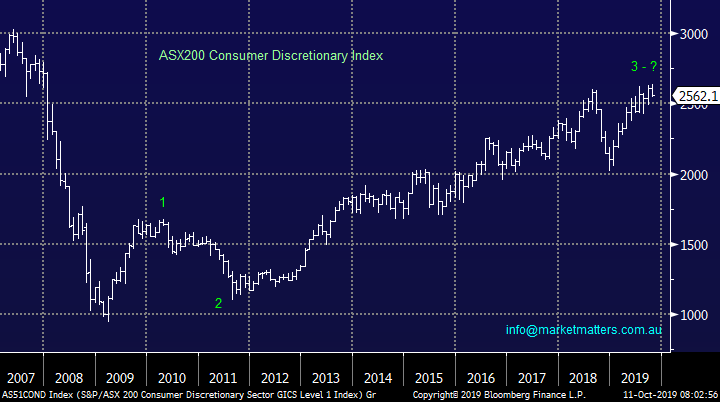
5 ASX200 Consumer Discretionary Index
The Australian consumer Discretionary Index has rallied very strongly over the last 8-years but credit remains tight and the local consumer heavily weighed down in debt. We question whether optimism has gotten ahead of itself in this case, to us the risk / reward feels very poor for the bulls - Stocks in this large sector include Flight Centre (FLT), Star Entertainment (SGR), JB HIFI (JBH), Harvey Norman (HVN) and Domino’s Pizza (DMP).
MM is very close to turning bearish the ASX Consumer Discretionary sector.
ASX200 Consumer Discretionary Index Chart
Conclusion (s)
As is often the case when you trawl through a number of stocks and sectors the most common result is neutral but this should be no great surprise as markets trade sideways ~85% of the time. The 2 standouts to MM from our work this morning:
1 – The Healthcare Index looks set to make fresh all-time highs implying its too early to switch from growth to value.
2 – The Consumer Discretionary Index is extremely close to generating a major technical sell signal which coincides with simple logic at this point in time.
Global Indices
No real change, we are looking for a move to the downside but recent weakness has failed to follow through with any meaningful momentum.
US stocks look vulnerable to the downside but the trend remains sideways.
US Russell 2000 Index Chart
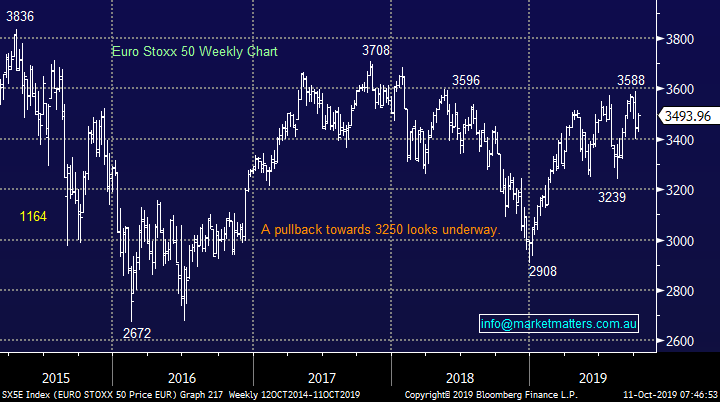
Similar to US indices European indices feel bearish technically but there’s still no commitment in either direction at this point in time.
Euro Stoxx50 Chart
Overnight Market Matters Wrap
· The US equity markets rallied on optimism that the US and China will agree to a partial trade deal. The Dow, S&P 500 and NASDAQ all closed circa 0.6% higher, while all European markets closed in the black.
· President Trump noted that he will meet with the Chinese Vice Premier Liu on Friday (US time). Liu said China was willing to reach an agreement to prevent an escalation in the tariff war.
· The British and Irish leaders said they may have found a way to get a deal done on Brexit before the end of the month when the UK is due to leave the European Union. The British pound rallied as a result with the possibility of a deal as early as next week.
· On the commodities front, copper and nickel rallied 1-2%, while cash zinc rose 4% on the LME. Iron ore is ~3% higher and oil climbed 2%. Gold sold off to $US1494.55/oz. with BHP expected to outperform the broader market after ending its US session up an equivalent of 1.98% from Australia’s previous close.
· The December SPI Futures is indicating the ASX 200 to open 51 points higher, testing the 6600 level this morning.
Have a great day!
James & the Market Matters Team
Disclosure
Market Matters may hold stocks mentioned in this report. Subscribers can view a full list of holdings on the website by clicking here. Positions are updated each Friday, or after the session when positions are traded.
Disclaimer
All figures contained from sources believed to be accurate. All prices stated are based on the last close price at the time of writing unless otherwise noted. Market Matters does not make any representation of warranty as to the accuracy of the figures or prices and disclaims any liability resulting from any inaccuracy.
Reports and other documents published on this website and email (‘Reports’) are authored by Market Matters and the reports represent the views of Market Matters. The Market Matters Report is based on technical analysis of companies, commodities and the market in general. Technical analysis focuses on interpreting charts and other data to determine what the market sentiment about a particular financial product is, or will be. Unlike fundamental analysis, it does not involve a detailed review of the company’s financial position.
The Reports contain general, as opposed to personal, advice. That means they are prepared for multiple distributions without consideration of your investment objectives, financial situation and needs (‘Personal Circumstances’). Accordingly, any advice given is not a recommendation that a particular course of action is suitable for you and the advice is therefore not to be acted on as investment advice. You must assess whether or not any advice is appropriate for your Personal Circumstances before making any investment decisions. You can either make this assessment yourself, or if you require a personal recommendation, you can seek the assistance of a financial advisor. Market Matters or its author(s) accepts no responsibility for any losses or damages resulting from decisions made from or because of information within this publication. Investing and trading in financial products are always risky, so you should do your own research before buying or selling a financial product.
The Reports are published by Market Matters in good faith based on the facts known to it at the time of their preparation and do not purport to contain all relevant information with respect to the financial products to which they relate. Although the Reports are based on information obtained from sources believed to be reliable, Market Matters does not make any representation or warranty that they are accurate, complete or up to date and Market Matters accepts no obligation to correct or update the information or opinions in the Reports. Market Matters may publish content sourced from external content providers.
If you rely on a Report, you do so at your own risk. Past performance is not an indication of future performance. Any projections are estimates only and may not be realised in the future. Except to the extent that liability under any law cannot be excluded, Market Matters disclaims liability for all loss or damage arising as a result of any opinion, advice, recommendation, representation or information expressly or impliedly published in or in relation to this report notwithstanding any error or omission including negligence.


