Are Australian Tech Stocks Vulnerable? (WTC, ALU, APT, Z1P, APX, XRO)

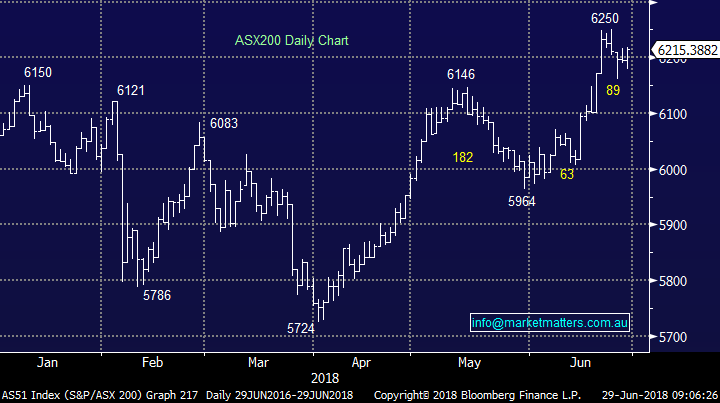
The ASX200 once again surprised on the upside yesterday as the typical end of year window dressing continued - the market defying the overseas weakness from the prior session. The Resource stocks led the way while we also saw some strong buying in U.S earners. Macquarie Group (MQG) a clear standout closing at $126.70 while we even saw some buying in QBE Insurance (QBE) which enjoyed a broker upgrade. With the last trading of the Financial Year now upon us, it feels like the ASX will sign off the year with an overall gain of around ~8% before dividends – not a bad effort considering the huge negative influence of the local banking sector. We’ll pen a full EOFY wrap up in this weekend’s report out on Sunday.
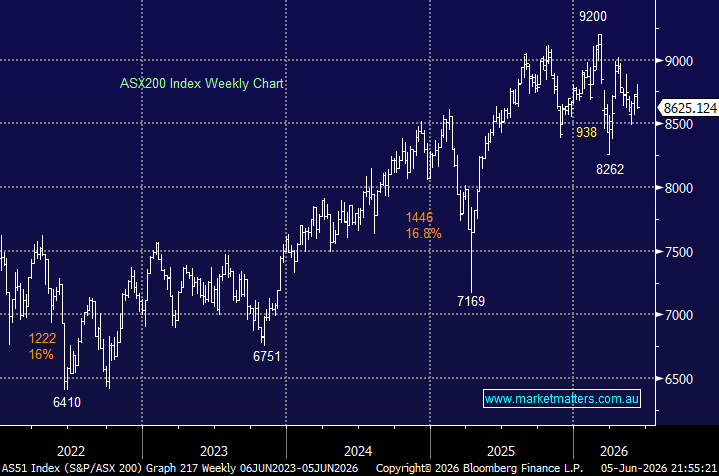
· Short-term MM is neutral with a close below 6140 required to switch us bearish, however we remain in “sell mode”.
ASX 200 Chart
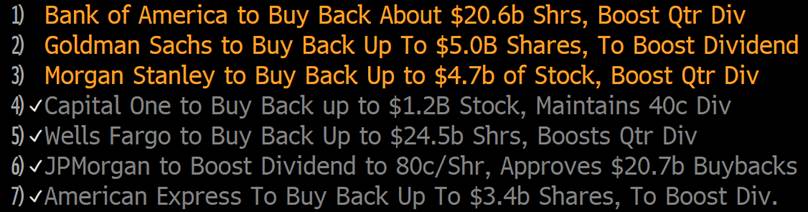
Overnight US stocks clawed back some of their recent losses with the NASDAQ seeing some buy interest. The banking stress test results were out and this morning our Bloomberg is full of headlines about more share buy backs and dividends. Back in 2010 the U.S passed laws that made annual testing of banks compulsory and with that the regulators now have a bigger say in the bank’s capital management plans. Deutsche Bank’s U.S unit failed the test with the Federal Reserve having issues with their internal controls – not a big surprise. Share buy backs have been a massive component of overall buying this year and it looks set to continue over the next 12 months.
Bank of America for instance say they can buy about $20b of shares versus their current market capitalisation of $290b – or in other words they will likely be the biggest buyer of their own shares over the next 12 months buying up to ~7% of their own stock. That theme is playing out across the sector and broadly across the market.
Bank buy backs confirmed overnight
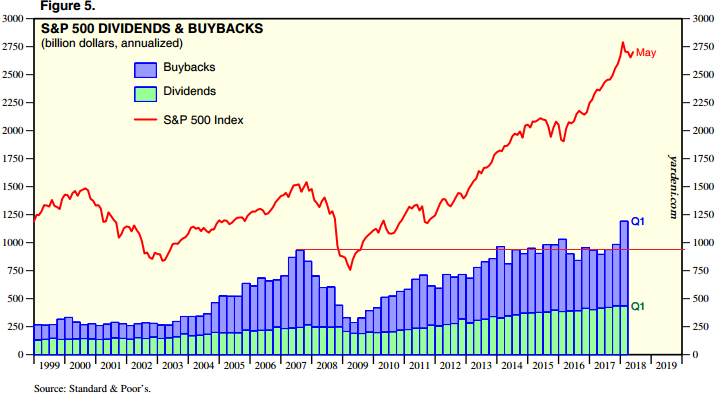
The flipside of that scenario is that if conditions become more difficult, and the market gets nervous, banks will likely conserve capital rather than use it to buy back stock and that will take the biggest buyer out of the market. That could then be further compounded by the huge amount of money sloshing around in passive funds – ETFs. This is typically trend following money that is more transient – another theme that has the potential to supercharge any market weakness.
Buybacks peaked just before the GFC
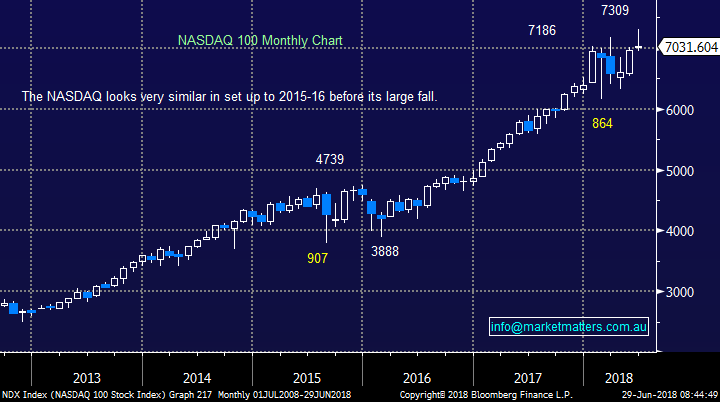
Today’s report is going to focus on local technology stocks – the ‘go to’ companies of the last 12 months with some simply exceptional performances. As subscribers would know, we often quote the NASDAQ as a leading index and we believe it’s showing clear signs of fatigue. If we’re correct in our view that the US market feels very similar to how it did back in 2015 /6 and if this unfolds according to our roadmap not only will the NASDAQ correct another 10% but it will probably take at least a year before finding enough strength for an attempt at further meaningful gains. That would have clear negative ramifications for local tech stocks.
US NASDAQ Chart
Australian Technology Stocks
The bulk of the stocks outlined below have enjoyed an exceptional run in the last 12 months – a combination of good growth, good stories and a market that is happy to pay up for both.
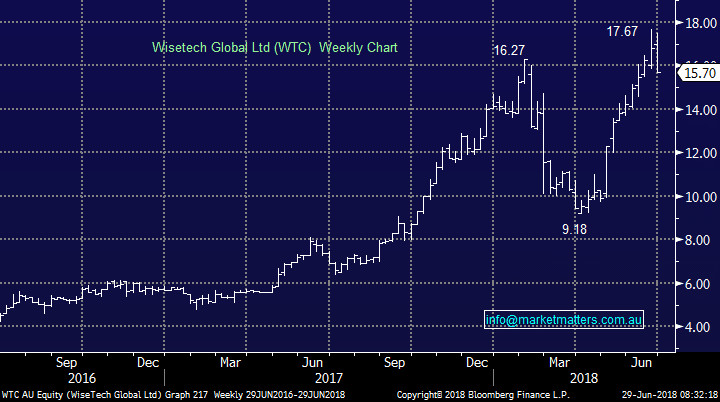
1 WiseTech Global (WTC) $15.70
An exceptional performer in FY18 adding ~121%, with the logistics software company growing organically but also through a string of acquisitions. They now trade on a huge 108x forward earnings however their growth rates are big. One measure we often use is price to growth which divides price to earnings by the earnings growth rate (PEG). In terms of WTC, this is on a PEG of 4.04
Technically, a pullback towards $10 would not surprise, especially with the NASDAQ association but we have no clear signals as yet.
WiseTech Global (WTC) Chart
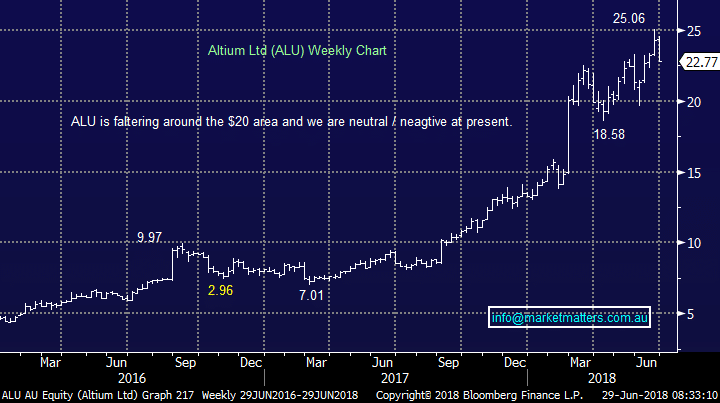
2 Altium (ALU) $22.77
Altium is a printed circuit board design software provider that has also enjoyed an exceptional run in FY18 adding 154%. Printed Circuit Boards (PCB’s) are found in pretty much every electrical device and a simple scope around the house shows that we have more electrical devices now than ever before – and the trend is only going one way!
Technically, ALU looks very vulnerable to test back below $20.
Altium (ALU) Chart
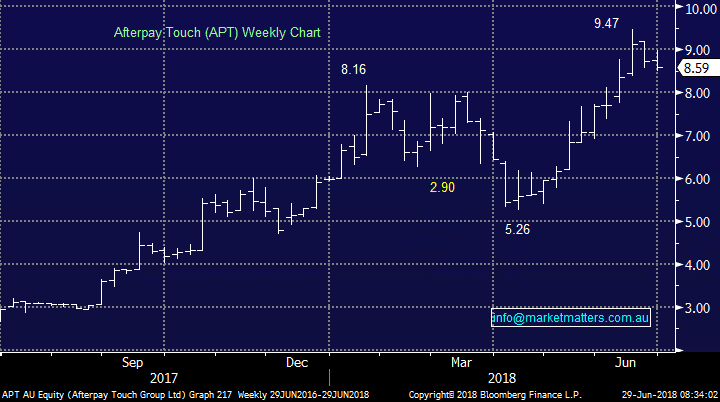
3 Afterpay Touch (APT) $8.59
Just as the name suggests, this is an online payment system used by a huge number of users around the country (and now in the U.S) to buy things, and pay for them later – a new age version of the lay-by system. Again, a company that has run hard this year but the obvious question now is will it continue to run in FY19? It trades on a massive P/E of 150x however it’s all about growth, a lot of which seems to be built into the price.
Technically, APT remains bullish but we would not be long if it cannot hold $8 and it would technically then test $5 fairly quickly – a scary thought for holders.
Afterpay Touch (APT) Chart
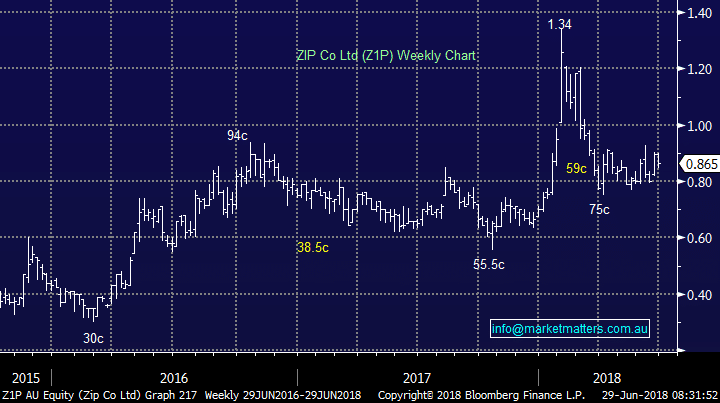
4 Zip Co (Z1P) 0.865c
A company with some similarities to AfterPay however they provide finance for larger purchases at the point-of-sale mainly in travel, retail, health and even education. We’ve covered Z1P earlier in the year as a BUY however we did not pull the trigger. The concern for Z1P (and APT) is around the prospect for regulation which would hurt the sector in the short term (but would ultimately create higher barriers to entry for potential new entrants).
Technically, Z1P is in the too hard basket but a break back under 78.5c looks likely to us
Zip Co (Z1P) Chart
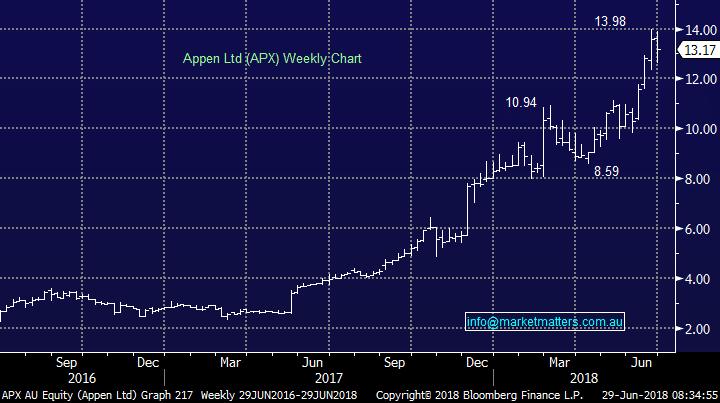
5 Appen (APX) $13.17
Appen is involved in the growing area of AI (artificial intelligence) providing high quality data to a large cross section of corporates. This is clearly a growing area and Appen is well placed to take advantage of it. A 238% gain this year in its share price is impressive however APX trades on 40x next year’s projected earnings – a less scary proposition than some others.
APX looks neutral just here but technically we would be a seller of fresh highs.
Appen (APX) Chart
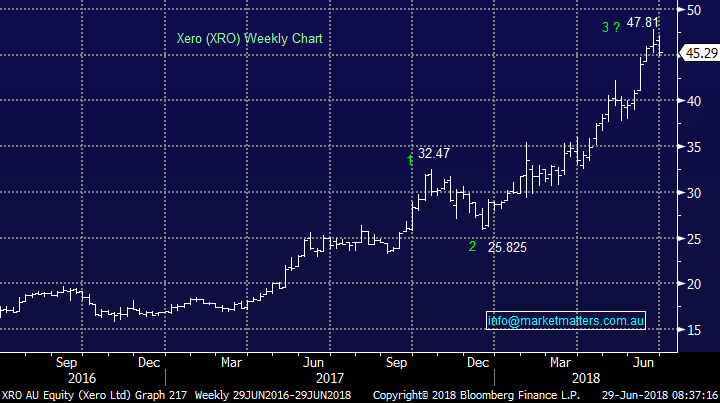
6 Xero (XRO) $45.29
Online cloud based accountancy software that is loved by many accountants including my own. XRO is clearly in the popular space at present but as such, it’s not cheap but nor should it be! Like much of the tech space, it can be volatile and chasing strength as opposed to buy one of the regular pullbacks can put pressure on investors’ minds.
Technically we are neutral here but interested into a pullback below $40
Xero Ltd (XRO) Chart
Conclusion (s)
We are negative the NASDAQ at current levels and are therefore we have a negative bias on local tech stocks
We will revisit the above stocks into further weakness if it plays out
Overnight Market Matters Wrap
· The US equity markets closed higher overnight, in attempt to climb back in its game of snakes and ladders.
· On the commodities front, crude oil rallied, while the ‘safe haven’ asset, gold lost some if its lustre.
· BHP is expected to outperform the broader market after ending its US session up an equivalent of 0.62% from Australia’s previous close.
· The September SPI Futures is indicating the ASX 200 to open 20 points higher towards the 6235 level this morning.
Have a great day!
James & the Market Matters Team
Disclosure
Market Matters may hold stocks mentioned in this report. Subscribers can view a full list of holdings on the website by clicking here. Positions are updated each Friday, or after the session when positions are traded.
Disclaimer
All figures contained from sources believed to be accurate. Market Matters does not make any representation of warranty as to the accuracy of the figures and disclaims any liability resulting from any inaccuracy. Prices as at 29/06/2018
Reports and other documents published on this website and email (‘Reports’) are authored by Market Matters and the reports represent the views of Market Matters. The MarketMatters Report is based on technical analysis of companies, commodities and the market in general. Technical analysis focuses on interpreting charts and other data to determine what the market sentiment about a particular financial product is, or will be. Unlike fundamental analysis, it does not involve a detailed review of the company’s financial position.
The Reports contain general, as opposed to personal, advice. That means they are prepared for multiple distributions without consideration of your investment objectives, financial situation and needs (‘Personal Circumstances’). Accordingly, any advice given is not a recommendation that a particular course of action is suitable for you and the advice is therefore not to be acted on as investment advice. You must assess whether or not any advice is appropriate for your Personal Circumstances before making any investment decisions. You can either make this assessment yourself, or if you require a personal recommendation, you can seek the assistance of a financial advisor. Market Matters or its author(s) accepts no responsibility for any losses or damages resulting from decisions made from or because of information within this publication. Investing and trading in financial products are always risky, so you should do your own research before buying or selling a financial product.
The Reports are published by Market Matters in good faith based on the facts known to it at the time of their preparation and do not purport to contain all relevant information with respect to the financial products to which they relate. Although the Reports are based on information obtained from sources believed to be reliable, Market Matters does not make any representation or warranty that they are accurate, complete or up to date and Market Matters accepts no obligation to correct or update the information or opinions in the Reports. Market Matters may publish content sourced from external content providers.
If you rely on a Report, you do so at your own risk. Past performance is not an indication of future performance. Any projections are estimates only and may not be realised in the future. Except to the extent that liability under any law cannot be excluded, Market Matters disclaims liability for all loss or damage arising as a result of any opinion, advice, recommendation, representation or information expressly or impliedly published in or in relation to this report notwithstanding any error or omission including negligence.
To unsubscribe. Click Here