Crude oil is flirting with $US50/barrel can our energy sector defy the weakness? (WPL, STO, BPT)
The ASX200 had a relatively quiet session yesterday with the market finally closing down just 1-point, the Healthcare stocks were the clear best on ground while the Energy & IT sectors had a tough day at the office. The “yield play” stocks remain in vogue with gains from all the traditional names however Telstra (TLS) was the clear standout rallying almost 2% to approach 2-year highs, we are now reassessing our decision to take profit on the Telco, its currently feeling premature – at MM we are never too proud to re-enter a stock at a higher price than we exited if we believe it’s the correct investment path.
Under the hood we only saw one stock rally by more than 5% and that was waste management business Bingo (BIN), which happily we own in the MM Growth Portfolio, on the negative side of the ledger we actually saw 9-stocks fall by more than 5% from a diverse group including recent IT market darling Appen (APX) -7.1%, retailer Harvey Norman (HVN) -7.4% and nickel miner Western Areas (WSA) -5.1% ; we will look at the 2 largest losers later in this morning’s report.
The Retail sector was also a major loser yesterday with all 7 of the stocks in the ASX200 closing in the red producing an average fall of 3.6% as the fear of weak consumer spending over the next few years attracted headlines. Wesfarmers certainly dampened the sectors sentiment on the day when they announced weaker than expected sales growth in its Kmart and Target divisions leading to the stock falling -5.2%, its lowest close in 3-weeks. It’s a simple case of “you cannot have your cake and eat it” for stocks, they are excited by falling interest rates but it’s the indebted, closed wallet, average Australian that’s creating the economic weakness which has kick started the RBA back into action.
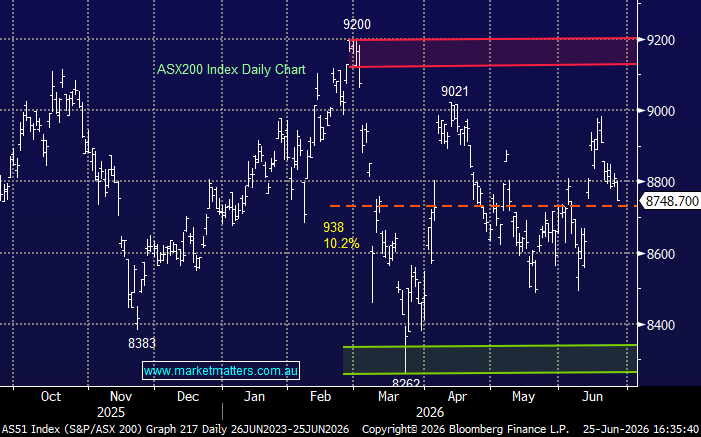
MM is now neutral the ASX200 following its test of the 6600-area but we remain bullish global equities for now.
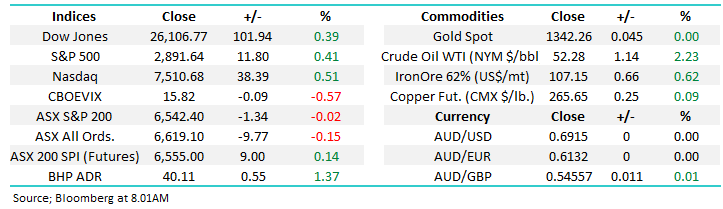
Overnight US stocks were firm with the Dow closing up 101-points but the standout move was iron ore which surged 3% making fresh 2019 highs. The SPI futures are calling the local market to open up about 10-points helped by BHP which finished up over 50c In the US, its likely to be yet another day in the sun for BHP, Fortescue and RIO.
In today’s report we have considered the Energy sector as the crude oil price continues to test the $US50/barrel level, around 25% below its April high = a bear market!
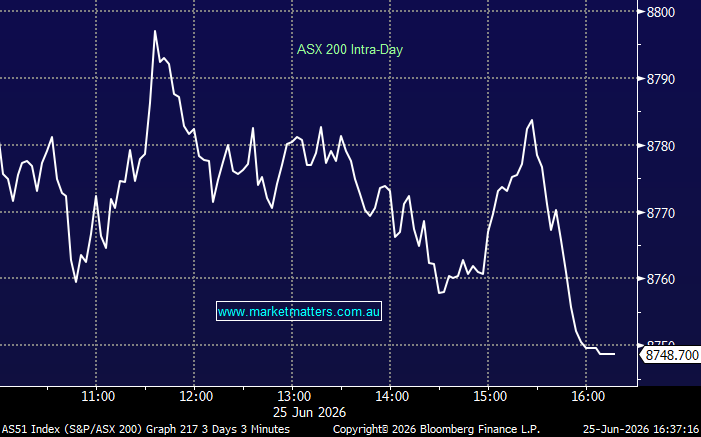
ASX200 Chart

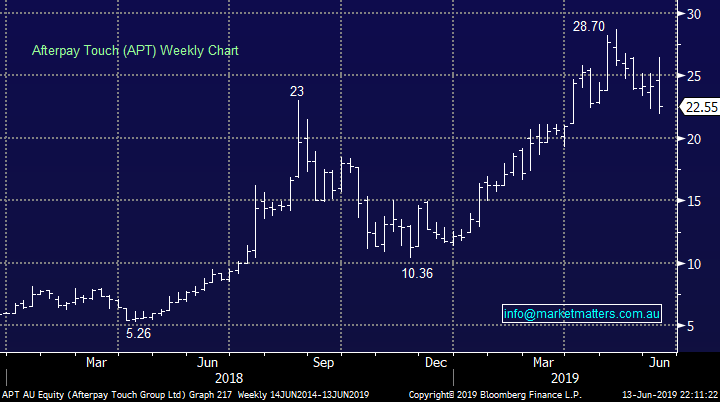
Yesterday Afterpay Touch (APT) was smacked over 12% following the announcement that the crime watchdog AUSTRAC wanted an audit of the buy now / pay later business, with special attention to its compliance, anti-money laundering and counter-terrorism controls.
The news coincidentally came in the same week the company raised $300m in new equity while the 2 founders + some of the other management team took $100m off the table – good timing.
MM remains uninterested in APT & the Australian IT sector believing them to be generally too expensive compared to their global peers.
Afterpay Touch (APT) Chart
Yesterday we wrote a timely short note on Challenger (CGF) just a few hours before the company announced a downgrade, clearly luck on our part but our view was smack on : “MM remains short-term bearish CGF looking for at least another 8% downside”
While the stocks tempting from a technical perspective into new lows, when we consider both the market and companies cyclical position we believe patience is the prudent course of action at this point in time.
MM is neutral to bearish CGF with a technical target now ~$6.
Challenger (CGF) Chart

Crude is down 25% since April, a recessionary sign? Can our stocks hold up?
As the title says crude has endured a very tough couple of months as President Trumps constant threat to global trade weighs on this highly regarded economic activity indicator. Crude oil along with bond yields tells us that the global economy is in real danger of slipping into a recession.
We can now see crude oil rotating between $US50 and $56 for a few weeks but the major risks remain to the downside. At MM we believe crude oil is a sell into bounces as opposed a buy into weakness.
This takes us to 2 initial conclusions:
1 – The global economy will get worse in 2019/2020 suggesting interest rates will go lower as bond yields are implying while a recession is likely.
2 – Australian energy stocks are likely to underperform moving forward.
Crude Oil Chart

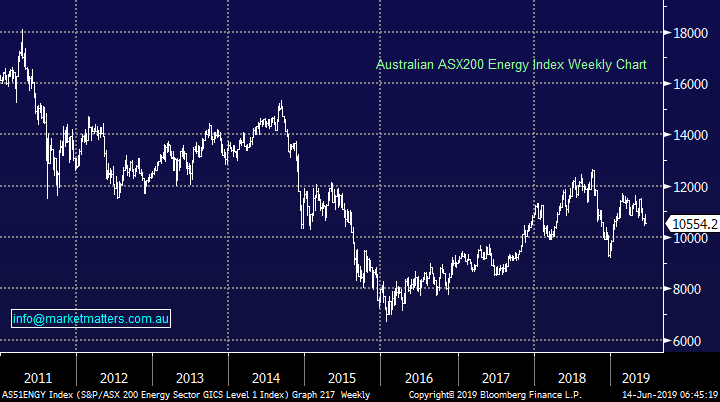
Moving onto the ASX200’s Energy sector which has significantly outperformed crude oil through 2019 – it’s done a pretty good job of ignoring the 25% plunge in the oil price. This suggests one of two things, either we are going to get a straw that breaks the camel’s back sort of fall in the respective stocks and they’ll play catch up on the downside, or the sector is correctly forecasting a recovery in the oil price – the latter of which is not something President Trump wants leading into an election next year.
While local energy stocks have outperformed the price of crude, when considered against a backdrop of a strong local market that’s not a huge surprise. e.g. over the last 3-months CBA is +10.3% and CSL +8.4% but the average move of the 12 names in the ASX200’s Energy sector has been over -11%, that’s a sobering level of underperformance even though the most significant falls have been in the coal names.
Conversely it’s easy to argue that our oil stocks are holding up ok considering the underlying commodity has entered a painful bear market, there’s always 2 sides to a coin!
This leads us to have no firm view at a sector level.
ASX200 Energy Index Chart
However all stocks should be evaluated on their individual merits, today we have looked at 3 majors in the 12 strong ASX200 Energy sector
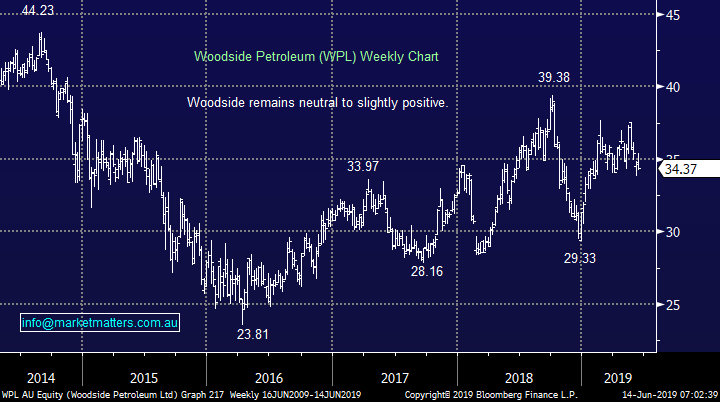
1 Woodside Petroleum (WPL) $34.37
Oil and gas business WPL is undoubtedly a quality business which is illustrated by our position in the Income Portfolio, purchased in March, still hovering around the breakeven and managing to largely ignore the plunge in crude.
The stock currently yields almost 6% fully franked making it an excellent play for that portfolio if the underlying crude oil price remains solid, hence our quandary – its next dividend is paid in August. Technically WPL looks capable of pushing back towards the $37 area, almost 10% higher however a supportive Crude price is needed.
MM is considering selling our WPL position into strength.
Woodside Petroleum (WPL) Chart
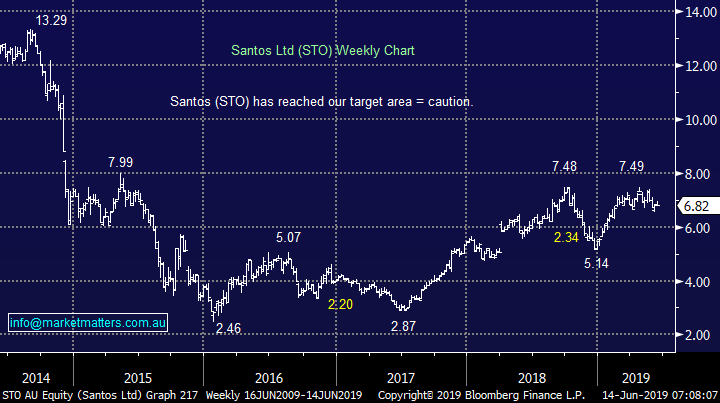
2 Santos (STO) $6.82
STO continues to struggle around our medium term $7.50 target area and we feel this is likely to continue. The oil and gas explorer / producer has like WPL largely ignored the oil price in 2019 but its likely to need higher prices in the commodity before the stocks can attempt fresh 2019 highs.
MM remains negative STO around the $7.50 area.
Santos (STO) Chart
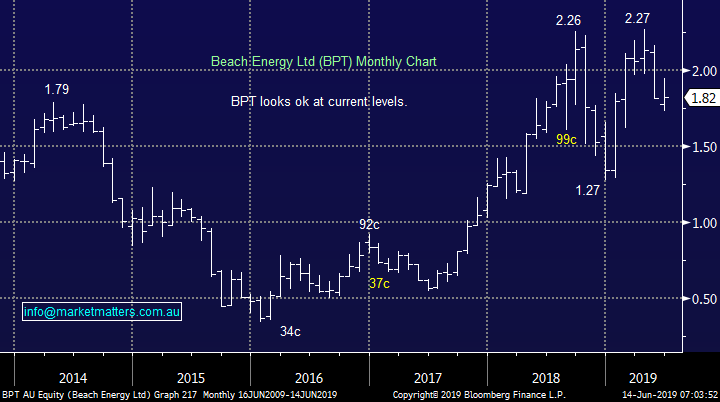
3 Beach Energy (BPT) $1.82
The 3rd oil / gas explorer & producer looked at today is BPT which is performing well operationally and financially while adding exploration acreage with longer-term potential. On June 24 they will be added to the S&P/ASX 100 index.
However the technical picture looks noticeably darker when compared to both WPL and STO, an important factor when we are not keen on the sector medium-term.
Investors / traders wanting exposure in the sector should steer more towards STO and WPL in our opinion.
MM is neutral to bearish BPT.
Beach energy (BPT) Chart
Conclusion (s)
MM believes the Energy sector is a sell into strength as opposed to a buy into weakness hence we are not looking to add any names to our Portfolio’s.
Interestingly 2 of the 3 stocks considered today look mildly bullish short-term which coincides with our thoughts around both global stocks and the crude oil price.
Global Indices
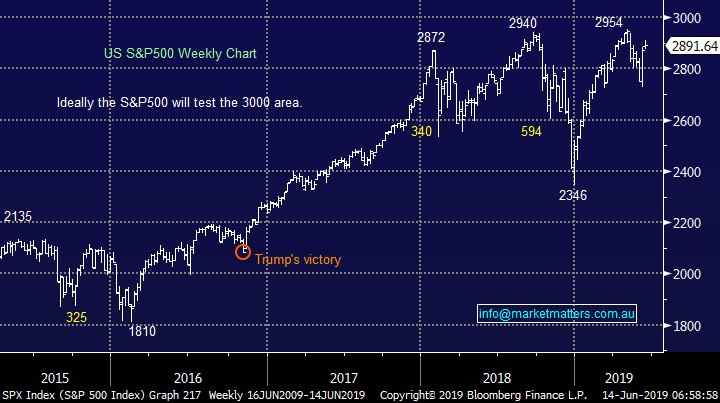
Again nothing new with our preferred scenario - the recent pullback was a buying opportunity although we are initially only looking for a test of / slight new 2019 highs from US indices.
The current dovish stance by the Fed has helped the S&P500 get within 2% of its all-time high, perhaps some positive news from this month’s G20 meeting between the US & China on trade will create the market optimism for a test of the large psychological 3000 area.
US S&P500 Index Chart
No change again with European indices, we remain cautious European stocks but the tone has improved recently and fresh highs in 2019 look a strong possibility.
German DAX Chart

Overnight Market Matters Wrap
· Wall St rebounded overnight, iron ore jumped 3% to 5 year highs of US$110/ tonne and the oil price rebounded 4% at one stage following a bomb attack on 2 crude ships in the Gulf of Oman, which heightened Middle Eastern tensions after the US blamed Iran for the attacks.
· Secretary of State Mike Pompeo claimed Iran “was lashing out” because of the impact of economic sanctions. The oil price ended the session about 2.3% higher. The iron ore price hit the highest level since April 2014 as under supply concerns continue to squeeze the spot market. Gold also jumped 0.7% to US1345/oz. on the rising Middle East tensions.
· The US markets rallied between 0.4% (Dow and S&P 500) and 0.6% (NASDAQ) led by the technology, media and energy stocks. Walt Disney in particular rallied over 4% after broker upgrades on the back of the potential of its new streaming services. Locally the ASX is set to finish the week on a firmer note (futures +0.1%), with iron ore and oil stocks set to lead the market higher. Despite the firmer commodity prices the A$ continues to languish at US69.15c
Have a great day!
James & the Market Matters Team
Disclosure
Market Matters may hold stocks mentioned in this report. Subscribers can view a full list of holdings on the website by clicking here. Positions are updated each Friday, or after the session when positions are traded.
Disclaimer
All figures contained from sources believed to be accurate. Market Matters does not make any representation of warranty as to the accuracy of the figures and disclaims any liability resulting from any inaccuracy. Prices as at 14/06/2019
Reports and other documents published on this website and email (‘Reports’) are authored by Market Matters and the reports represent the views of Market Matters. The MarketMatters Report is based on technical analysis of companies, commodities and the market in general. Technical analysis focuses on interpreting charts and other data to determine what the market sentiment about a particular financial product is, or will be. Unlike fundamental analysis, it does not involve a detailed review of the company’s financial position.
The Reports contain general, as opposed to personal, advice. That means they are prepared for multiple distributions without consideration of your investment objectives, financial situation and needs (‘Personal Circumstances’). Accordingly, any advice given is not a recommendation that a particular course of action is suitable for you and the advice is therefore not to be acted on as investment advice. You must assess whether or not any advice is appropriate for your Personal Circumstances before making any investment decisions. You can either make this assessment yourself, or if you require a personal recommendation, you can seek the assistance of a financial advisor. Market Matters or its author(s) accepts no responsibility for any losses or damages resulting from decisions made from or because of information within this publication. Investing and trading in financial products are always risky, so you should do your own research before buying or selling a financial product.
The Reports are published by Market Matters in good faith based on the facts known to it at the time of their preparation and do not purport to contain all relevant information with respect to the financial products to which they relate. Although the Reports are based on information obtained from sources believed to be reliable, Market Matters does not make any representation or warranty that they are accurate, complete or up to date and Market Matters accepts no obligation to correct or update the information or opinions in the Reports. Market Matters may publish content sourced from external content providers.
If you rely on a Report, you do so at your own risk. Past performance is not an indication of future performance. Any projections are estimates only and may not be realised in the future. Except to the extent that liability under any law cannot be excluded, Market Matters disclaims liability for all loss or damage arising as a result of any opinion, advice, recommendation, representation or information expressly or impliedly published in or in relation to this report notwithstanding any error or omission including negligence.