Looking at overseas financials for clues to local stocks
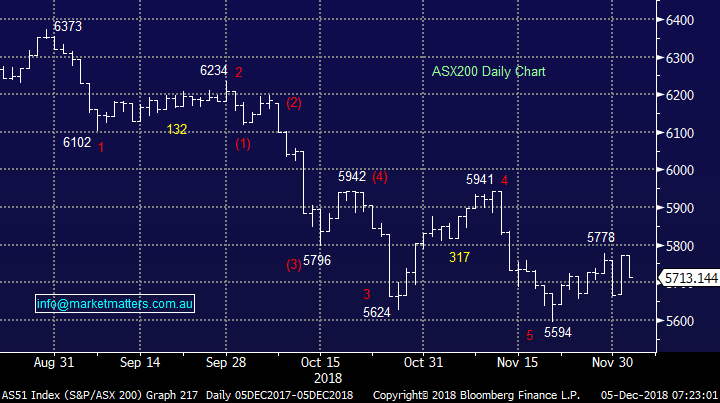
The ASX200 continues to impersonate a rollercoaster and although it’s still basically following what we expected, a few quieter days hovering around 5750 would certainly calm this bulls’ nerves! Yesterday only the Telco Sector courtesy of a bounce by Telstra (ASX: TLS) managed to close in the black – basically things were almost as weak as Monday was strong.
On a stock level we essentially saw mean reversion from Monday’s rally with the largest falls in many stocks that surged the most just 24-hours earlier. Overnight moves in the US showed how well the ASX200 can pre-empt large moves on overseas indices – no great surprise as the ASX200 is the first major index to open on a daily basis; sorry NZ. The recovery in the gold stocks also illustrated how quickly nerves returned to equity land.
In Tuesdays report we stated that MM was now in “sell mode”, perhaps our reader base is even larger than we thought!
On a more serious note remember the point we raised yesterday when we looked at seasonality:
1 – the Christmas rally usually starts in the first few weeks (relatively large window) but the top is usually in the last 48-hours.
2 – Hence don’t be surprised if the market struggles to kick ahead over the next week.
That cautious tone was clearly an understatement but we won’t get excited for a Christmas rally by the ASX200 until the market closes above 5800.
MM remains bullish the ASX200 short-term targeting a “Christmas rally” towards the 5900-6000 area.
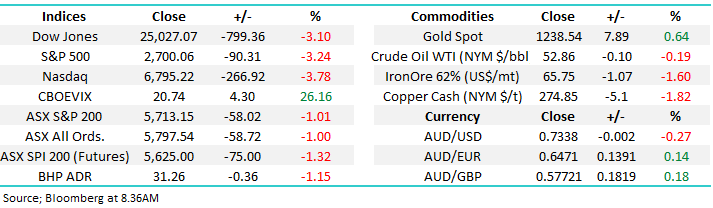
Overnight US / Europe were smacked with the Dow falling almost 800-points after Trumps top White House economic advisor back tracked from the president’s announcement that Beijing had agreed to reduce tariffs on U.S.-made cars. The SPI is calling the ASX200 down a painful 90-points as volatility continues.
Today’s report is going to focus on 6 major international financial stocks looking for any clues as to what comes next for this choppy equity market.
**Please note: US Markets are closed tonight for President Bush’s Funeral**
ASX200 Chart
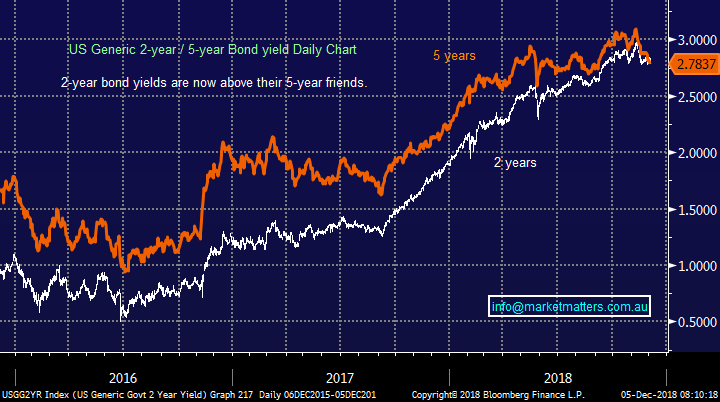
US stocks caught a major cold last night for 2 reasons, concerns around inverting yield curves and conflicting interpretations from the White House on the degree of success from the weekends G20 meeting – Trump & Co. love some volatility!! The US yield curve produced its first inversion on Monday night with the 2 – 5-year bond yield gap turning negative for the first time in over a decade – a strong sign of a looming recession and this may well have triggered some selling in the ASX200 yesterday.
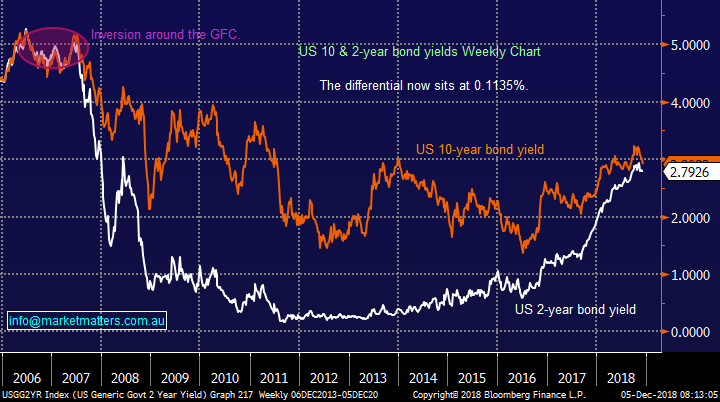
The gap between the 2 & 10-years is traditionally watched more carefully by the doomsday merchants and while this major signal has not been triggered it’s rapidly getting closer – this is likely to put further pressure on the Fed to slow its path of raising interest rates.
Simply when shorter dated bond yields rise above longer dated ones it implies a recession is looming – we have discussed this for months in the Weekend Report BUT it’s now unfolding. We will cover this topic further in today’s Income Note.
US 2 and 5-year Bond Yields Chart
US 2 and 10-year Bond Yields Chart
6 Global Financial & Banking Stocks
Rather than the more traditional overseas stocks like Apple, 3M, Tencent and Google today we have focused more on the financial sector which is especially important to the ASX200 with our Financial Sector making up over 30% of the ASX.
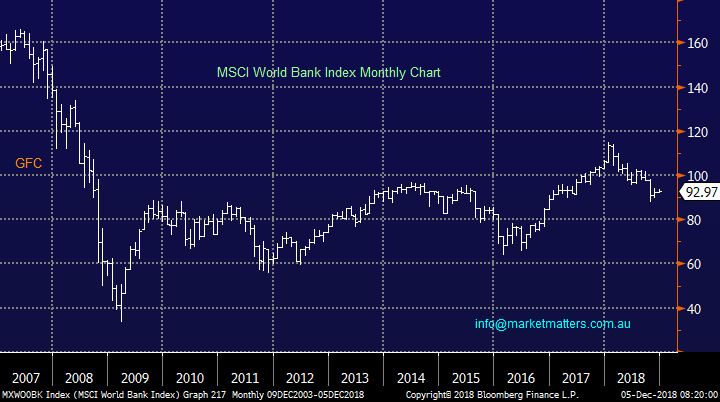
The world banking index is not a particularly pretty picture although we can see a 3-4% bounce in the coming weeks but the ~20% correction since January of this year feels clear and entrenched.
MSCI World Banking Index Chart
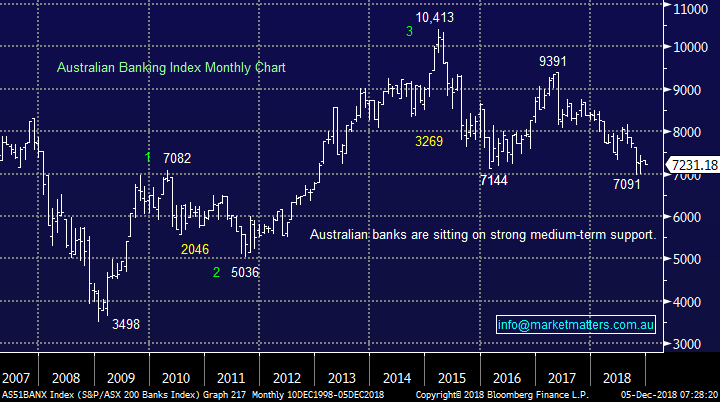
The good news is the Australian banks have a relatively low correlation to their global peers’ courtesy of the damning Banking Royal Commission i.e. we can run our own race to certain degree.
ASX200 Banking Sector Index Chart
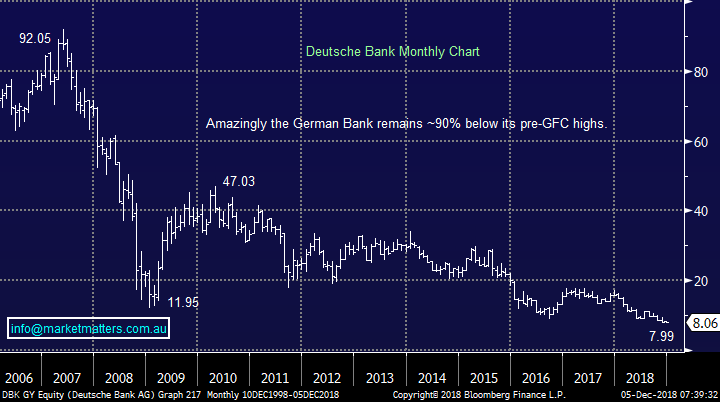
1 Deutsche Bank (GY: DBK) Euro 8.06
DBK has endured some enormous problems since the GFC which is reflected by its pretty dire share price i.e. its trading over 90% below its pre-GFC high.
However back in July they announced a net profit of just over 400 million Euros for the second quarter of the year, down 14% year on year but in line with expectations. They also said that its second-quarter results would be significantly above market expectations – the stock didn’t rally but it appears to have stopped falling.
In October they announced a net profit of 229 million Euros, down significantly on a year ago but forecasts beat analysts’ expectations. While we don’t believe the business is out of the woods by any means the risk / reward for a small position is very tempting. Technically there are no specific buy signals but its “feels” good around 8 Euro.
MM is mildly positive DBK around 8 Euro.
Deutsche Bank (GY: DBK) Chart
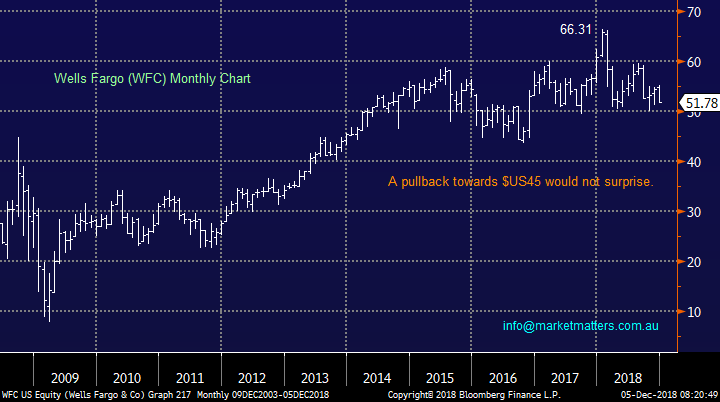
2 Wells Fargo (US: WFC) $US51.78
WFC has clearly been a great success since the GFC but it’s not been without major hiccups after being hit with similar problems to our own sector over the last few years i.e. since 2016 the bank has admitted to creating fake accounts, hitting customers with unfair mortgage fees and charging people for car insurance they didn't need.
Technically WFC looks destined to fall another 10% into 2019/20 – sorry Mr Buffett!
MM has no interest in WFC at current levels.
Wells Fargo (US: WFC) Chart
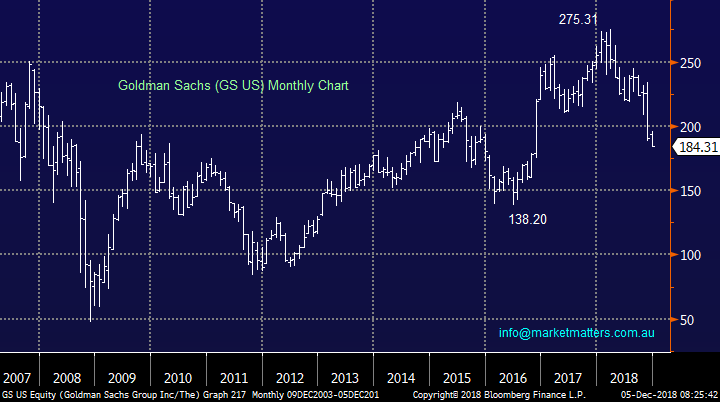
3 Goldman Sachs (US: GS) $US184.31
Global powerhouse GS is interestingly trading at the same price as in 2008 i.e. a lost decade if we exclude dividends.
The company beat “ the street” estimates in October by reporting $6.28 per share in earnings, exceeding the $5.38 estimate from analysts although trading expectations missed. Again the economic environment appears to be weighing on the share price.
Technically GS looks set to correct another 10%, or more.
MM has no interest in GS at current levels.
Goldman Sachs (US: GS) Chart
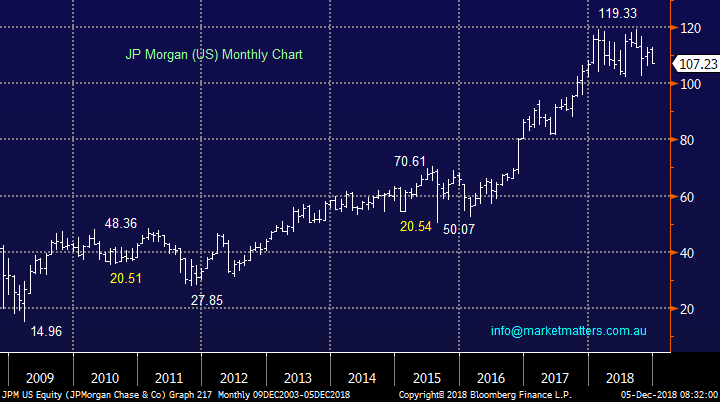
4 JP Morgan Chase (US: JPM) $US107.23
JPM has been a standout performer in the sector both in the US and globally – hats off to Jamie Dimon!
The company continues to kick goals and in October they reported better-than-expected earnings and revenue, only bond trading revenue was weak.
MM likes JPM closer to the $US100 region.
JP Morgan Chase (US: JPM) Chart
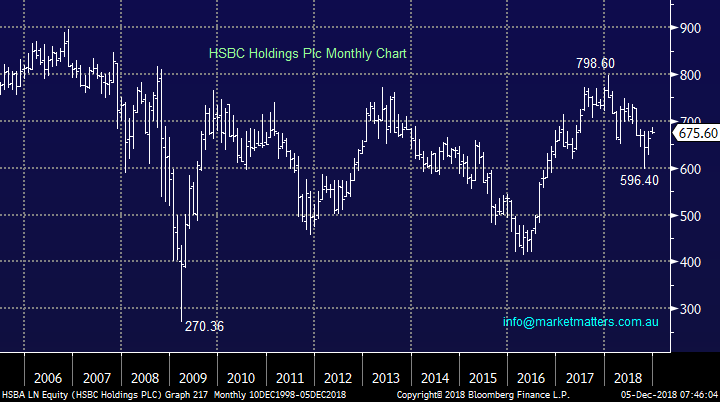
5 HSBC Holdings Plc (LN: HSBA) GBP 675.60
HSBC is the 5th largest bank in world and in June the new CEO John Flint unveiled plans to invest $17bn into expanding its Asian business i.e. they are looking to significantly expand as an Emerging Markets lender.
The company’s earning appear to have bottomed in 2016 and we like the feel of where they are heading – a true financial exposure into developing markets.
Technically HSBC looking bullish medium-term targeting the 800 area.
MM likes HSBC at current levels.
HSBC Holdings Plc (LN: HSBA) Chart
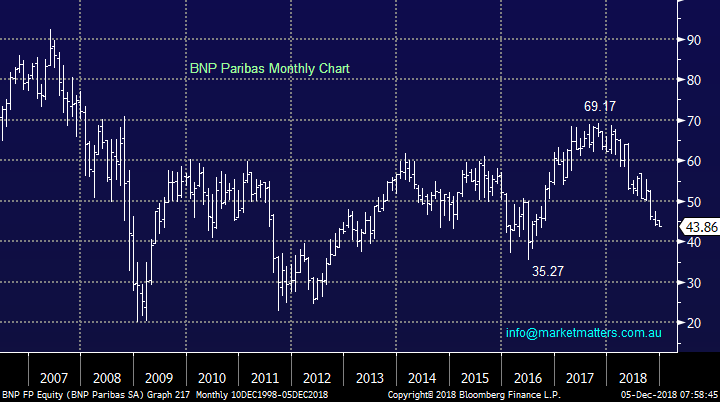
6 BNP Paribas (FP: BNP) Euro 43.86
BNP Paribas is the 8th largest bank by assets operating in over 70 countries and like many of their peers their share price has corrected hard in 2018 – over 30%. The bank released net income of over 2 billion Euros for the 3rd quarter of this year beating analysts’ expectations by over 6% but the shares continue to grind lower. The banks performing solidly in clearly challenging conditions.
Technically the French bank looks set to break under the psychological 40 area in 2019/20 – almost 10% lower.
MM would consider a small position in BNP ~10% lower.
BNP Paribas (FP: BNP) Chart
7 Macquarie Group (ASX : MQG) $116.35
The above trends provide a negative read-through for our own global investment bank, Macquarie while our negative short term view on the $US also has a negative influence on the ‘millionaires factory’.
Technically, the ‘millionaires factory’ looks set to test / break the $110 area.
We are negative MQG in the short term
Conclusion
Looking both in the rear view mirror and into 2019/2020 stock selection has dominated performance in the global financial and banking sector and appears likely to continue doing so:
Of the 6 stocks looked at today:
1 - MM likes HSBC and Deutsche Bank at current levels.
2 – We have no interest in WFC, GS and BNP at current levels.
3 – We like JPM around $US100.
4 – The implications above are net negative for MQG
Overseas Indices
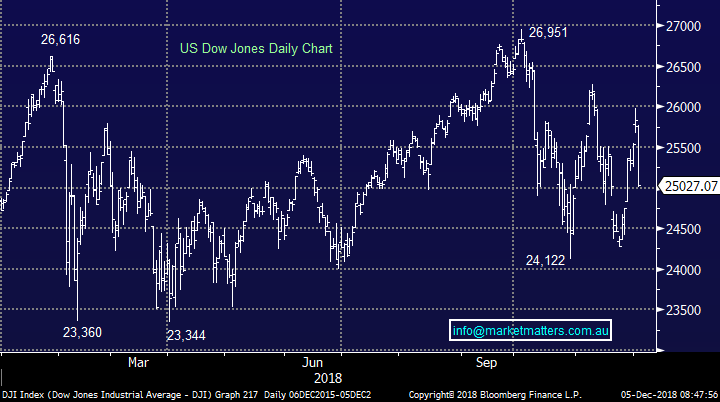
The US indices satisfied our downside bearish targets switching us to neutral / bullish but short-term they continue to be very choppy
US Dow Jones Chart
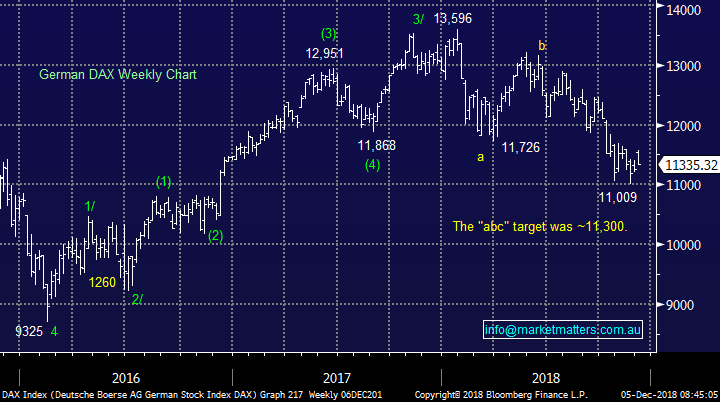
European indices are now also neutral with the German DAX hitting our target area which has been in play since January.
German DAX Chart
Overnight Market Matters Wrap
· Jitters followed through in the US overnight, as investors weigh on longer term US economic growth. At one stage, we witnessed the Dow dropping over 800 points, with the focus on a flattening bond yield curve, which generally is the first signal of slowing growth and increasing risks of a longer term recession.
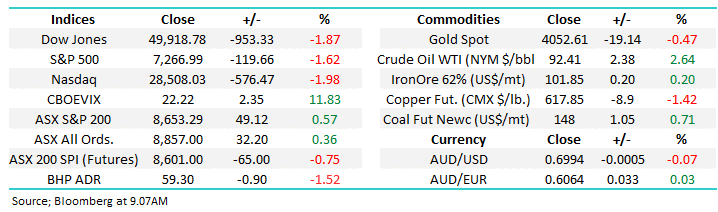
· Commodities were mixed, with gold hitting fresh month highs and oil slightly firmer ahead of this week’s OPEC meeting, which is expected to sanction production to reduce the current global glut. Iron ore was stronger, while base metals were led lower by copper price which dropped 1.82%.
· The December SPI Futures is indicating the ASX 200 to follow the US overnight and sell off 92 points towards the 5620 level this morning.
· All US Markets are closed tonight for President Bush’s Funeral
Have a great day!
James & the Market Matters Team
Disclosure
Market Matters may hold stocks mentioned in this report. Subscribers can view a full list of holdings on the website by clicking here. Positions are updated each Friday, or after the session when positions are traded.
Disclaimer
All figures contained from sources believed to be accurate. Market Matters does not make any representation of warranty as to the accuracy of the figures and disclaims any liability resulting from any inaccuracy. Prices as at 05/12/2018
Reports and other documents published on this website and email (‘Reports’) are authored by Market Matters and the reports represent the views of Market Matters. The MarketMatters Report is based on technical analysis of companies, commodities and the market in general. Technical analysis focuses on interpreting charts and other data to determine what the market sentiment about a particular financial product is, or will be. Unlike fundamental analysis, it does not involve a detailed review of the company’s financial position.
The Reports contain general, as opposed to personal, advice. That means they are prepared for multiple distributions without consideration of your investment objectives, financial situation and needs (‘Personal Circumstances’). Accordingly, any advice given is not a recommendation that a particular course of action is suitable for you and the advice is therefore not to be acted on as investment advice. You must assess whether or not any advice is appropriate for your Personal Circumstances before making any investment decisions. You can either make this assessment yourself, or if you require a personal recommendation, you can seek the assistance of a financial advisor. Market Matters or its author(s) accepts no responsibility for any losses or damages resulting from decisions made from or because of information within this publication. Investing and trading in financial products are always risky, so you should do your own research before buying or selling a financial product.
The Reports are published by Market Matters in good faith based on the facts known to it at the time of their preparation and do not purport to contain all relevant information with respect to the financial products to which they relate. Although the Reports are based on information obtained from sources believed to be reliable, Market Matters does not make any representation or warranty that they are accurate, complete or up to date and Market Matters accepts no obligation to correct or update the information or opinions in the Reports. Market Matters may publish content sourced from external content providers.
If you rely on a Report, you do so at your own risk. Past performance is not an indication of future performance. Any projections are estimates only and may not be realised in the future. Except to the extent that liability under any law cannot be excluded, Market Matters disclaims liability for all loss or damage arising as a result of any opinion, advice, recommendation, representation or information expressly or impliedly published in or in relation to this report notwithstanding any error or omission including negligence.