Market Matters 2019 Outlook including our forecasts for the year ahead
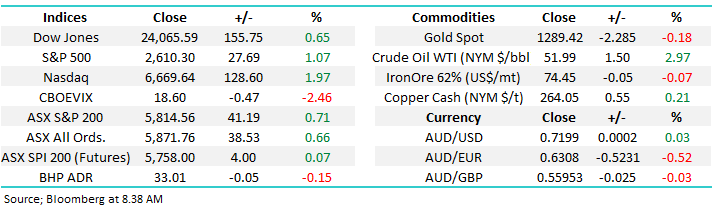
Goodbye 2018, clearly a tough year as we witnessed virtually all asset prices decline from equities to the sacred bellwether, property. The ASX200 fell almost 7% before we take into account dividends, closing well below the psychological 6000 level and over 11% below the years high in August. US Markets were similar although the ASX 200 actually outperformed marginally for the calendar year. However, dig a little deeper and it wasn’t all bad news, especially for investors who recognise that market characteristics are evolving as the longest bull market in history approaches its 11-year anniversary.
Commonly, statistics can be manipulated to make a point however when I look under the hood of the ASX200 over the past 12 months, the simple numbers surprised me – the market slipped less than 3% after dividends yet we saw 25 stocks rally by over 20% while 51 companies fell by the same margin. The odds were clearly against the uniformed investor in a down year but with almost 40% of the ASX200 ending the year up, or down, over 20% - clearly both opportunities and “land mines” were plentiful.
The MM mantra for 2018 remains firmly in play, we believe this year will again favour the more active / nimble investor. This 19th year of the 3rd millennium looks set to be another volatile and choppy year in our opinion with a number of macro-economic influences on the horizon to trigger bouts of both fear and greed, sound familiar?
Clearly we are not in a market to buy and hold as periods of excessive optimism and pessimism look likely to again surge through markets necessitating openminded investing and being prepared to sell strength and buy weakness – exactly what often feels uncomfortable!
Last year may have been negative but we still saw the ASX200 rally 11.3% from its April low while obviously falling 6.9% in Q1 and 15% from its August high, hence providing opportunities on both the buy and sell side of the ledger for both stocks and the index itself.
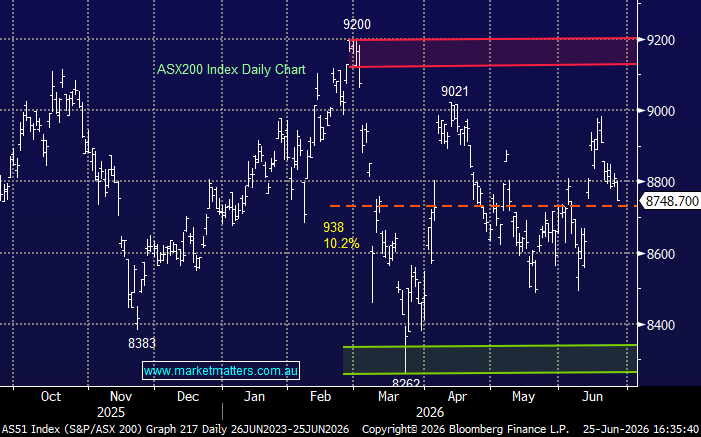
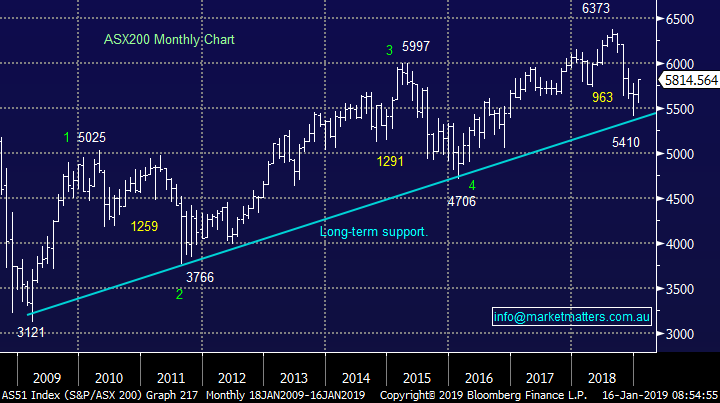
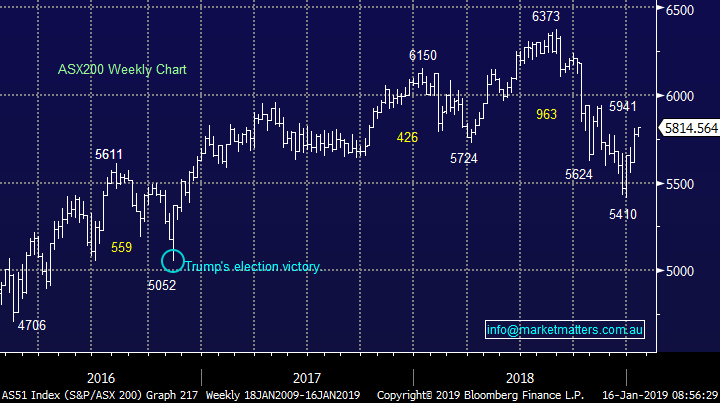
ASX200 Chart
While we’re extremely excited by 2019, lets first consider some of the highlights from the last 5 Market Matters annual outlook pieces and while obviously they are far from perfect we’re proud of them including a number of absolute gems amongst our calls.
2014 - We were unpopular, but correct, when we called BHP down to $20 when it was at $34 plus Woolworths to $25 when it was closer to $34.
2015 - Our favourite 3 stocks were RRL at $2.32 which rallied over 80%, Challenger at $8.05 which rallied 75% and Telstra (TLS) at $5 which then rallied 17% a nice trifecta.
2016 - We suggested this was the year to reconsider resources after they had an awful 2015, a great call with heavyweight BHP rallying 40%. Overall 25 of our 35 alerts (70%) were profitable during the year.
2017 - We targeted over 6000 for the ASX200 and 2400 for the S&P when many market players continually focused on likely pullbacks – although we did underestimate the strength in the US marginally! We stayed long all year and simply pushed back our call of a 25% correction to commence in 2018. For the first time since the 1980's we felt interest rates were headed higher globally and they did. We also felt Australian house prices and particularly apartment prices would plateau / decline, and importantly would not ‘crash’, this has certainly started to unfold in most parts of Australia – time will tell about the crash component of the call.
2018 – There were three major market consensus calls obvious in January of 2018; The market was bearish the $US and while we agreed in the short term our view that the US currency would actually end up for the year proved correct. Going into 2018, the market was very bullish Australian stocks following a strong end to 2017, we felt differently forecasting a choppy year with a negative bias overall. Commodities were in focus at the end of 2017 with the market extremely bullish thanks mostly to an expectation of coordinated global growth. We agreed with that call overall however warned that resources will have a choppy advance and weakness, not strength, should be bought. BHP traded in a 25% range through the year highlighting that volatility well.
We went on to make 10 key calls in 2018, and reflecting on them now is a worthwhile exercise. On balance, the scorecard was a solid one; We nailed US equities calling them to endure an early warning style pullback which eventuated with an almost 12% fall in January / February before a rally to fresh all-time highs, prior to a deeper correction which materialised in Q4 when the S&P500 tumbled over 20%.
We called crude to $US70/barrel which played out ahead of a savage sell off, resources to be choppy, bond yields to rise, the $US to rally after a fall in Q1 and Bitcoin as “definitely not an investment” – all these proved accurate. On the flipside, we called healthcare to underperform which it only did in Q4 and yield play stocks like Transurban to struggle, which proved wrong, although not dramatically so. We thought Banks could be bought into any pullbacks which proved too optimistic while our call that Telstra would oscillate between $3 and $4 was marginally off the mark, with the stock trading between $3.75 & $2.60, although it did pay 22cps in dividends.
All this means very little unless we actually make money from our views, and in 2018, 34 of our 46 alerts were profitable, a ~74% strike rate.
Now let’s move onto 2019, including sectors to both embrace and avoid.
Sitting down to consider the outlook for 2019 my initial thought is, I’d rather write this in February as I feel the market has not fully shown its hand as yet, however we don’t get paid for hindsight! One call that rolls on from 2018 is it remains the time for active investors. While it’s now questionable whether the longest bull market in history is or isn’t over, without stating the obvious, it’s closer to the end than the beginning which generally means increased volatility.
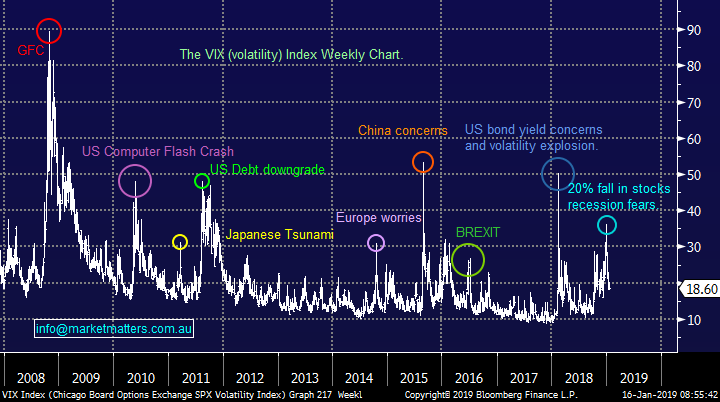
In 2018 we had 2 very clear resurgences in volatility:
1 – The panic in Q1 around increasing bond yields as the US economy continued to go from strength to strength.
2 – A 20% fall in stocks at the end of the year as looming recession fears gripped investors leading to the aggressive selling of the previously loved growth stocks.
The interesting and clear dichotomy here is the total about turn of macroeconomic opinion and thinking, with two seemingly divergent views both leading to major equity market corrections. As you read through our 10 forecasts for 2019, this will be a reoccurring theme.
Volatility Index (VIX) Chart
1 The ASX200 to again struggle
As I’m typing the ASX200 is back above the psychological 5800 level after bouncing over 7% from its December low, about half of the recovery by US stocks which of course fell more in December.
Unfortunately compared to other global markets, Australia cannot be considered cheap. Looking at a rudimentary price to earnings ratio (P/E) for major markets, Australia is back at 14.3x, Japan is on 11.5x, Europe ex US is 12.3x, Emerging Markets are 10.2x, even the United States is on 14.9x. We cannot see any compelling economic reasons why Global Managers would chase our market against others at current levels / valuations, particularly as we enter an election year. Local earnings revisions are still weak and it’s unlikely the next reporting season is going to be particularly exciting. While this trend is well understood by the market so is not necessarily a driver in the short term, it’s worth noting that a sustained bullish market trend needs to be supported by sustained earnings growth, which both locally and overseas seems unlikely at this juncture.
This brings us back to the ‘main game’ – at what levels from a markets perspective are stocks generally too cheap versus too expensive in this environment?
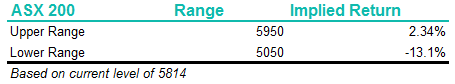
Since the GFC after we remove the outliers the ASX200 appears comfortable trading in an average 800 to 1000-point range. Putting ourselves on the spot as you do this time of year, our best guess is we see a range of 5950 to 5050. At the current ~5800 for the ASX200, this implies more downside than upside in aggregate terms, although a test of the upper range seems likely first before a choppy range bound year plays out.
Continue to sell strength and buy weakness but as we saw in December the potential declines after a 11-year bull market should not be underestimated.
ASX200 Chart
2 The optimism / pessimism elastic band will continue to be stretched.
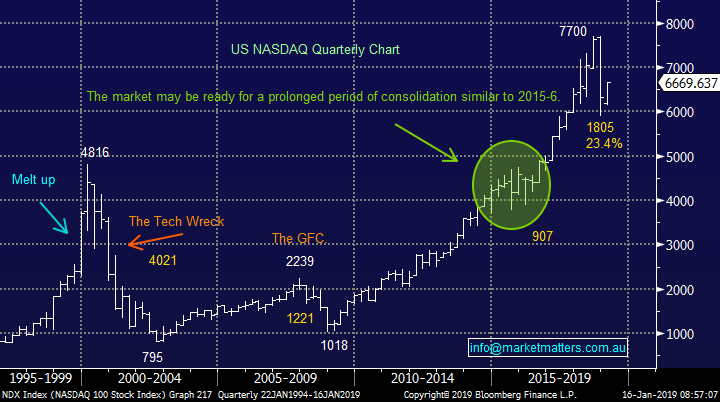
We’ve used the US NASDAQ here to illustrate our thoughts given it’s both relatively clear and a very good proxy when looking at risk on / risk off environments. It also provides a good road map for our own growth sector which as the market becomes more volatile, will likely present opportunity.
If we simply consider the 2 Australian growth stocks we hold in the Growth Portfolio - Appen (APX) and Altium (ALU) - having bought them both into late 2018 weakness, between the 2 of them throughout the year they experienced around 15 swings of 20% or more. Obviously selling too soon would have been detrimental in these cases where both stocks doubled in 2018 overall but it shows optimum buying / selling can enhance portfolio returns. Consequently we are keen to have a handle on the NASDAQ over the months ahead.
For now, we have 3 views on the NASDAQ / US stocks over 2019 listed with increasing importance below:
1 – US stocks have bounced ~15% from Decembers plunge but from a risk / reward perspective the next ~5% is probably now down i.e. we are more sellers than buyers in the short term.
2 – Our preferred scenario is US stocks actually chop higher for much of 2019, similar to 2015 / 2016 which is illustrated below.
3 – Until further notice we would be net sellers of stocks when the NASDAQ is above 7500 and net buyers when / if it again tests the 6000 region.
We are expecting a prolonged period of choppy consolidation from US equities as the benefits of tax reforms are behind us and fund managers consider what comes next under this very turbulent US administration.
US NASDAQ Chart
3 Continue to avoid the Australian consumer
I’ve read a lot over the break and the bulk of content on Australian equities discusses the risks of high household debt levels and the subsequent impact this will have on consumers appetite to ‘buy stuff’, particularly as house prices fall. The main question seems to be whether or not the wind will be let out of the balloon slowly or we see a more aggressive “pop”. From a global perspective, this remains a key reason why we don’t expect global fund managers to chase an already comparatively rich Australian market.
The average Australian now needs 16% of their income to service debt compared to the US at 8% but this is not a new statistic and as I said its being well and truly covered in the press – MM was discussing it well over a year ago!
While we generally like to go against the crowd, and stocks with exposure to the Australian consumer have endured an “anulus horribilis” e.g. JB HIFI (ASX: JBH) -24%, Harvey Norman (ASX: HVN) -25% and CSR Ltd (ASX: CSR) -40% implying that a significant portion of current known risks are built into the respective stocks, it still seems that a rapid recovery anytime soon is unlikely. While obvious value is emerging in this part of the market based on historical earnings, I caution that focussing on low multiples for cyclical business where a cyclical upturn is some way off will likely lead to pain in 2019.
Avoid stocks that are highly exposed to discretionary spending.
4 The “Big 3” stocks from a discussion perspective
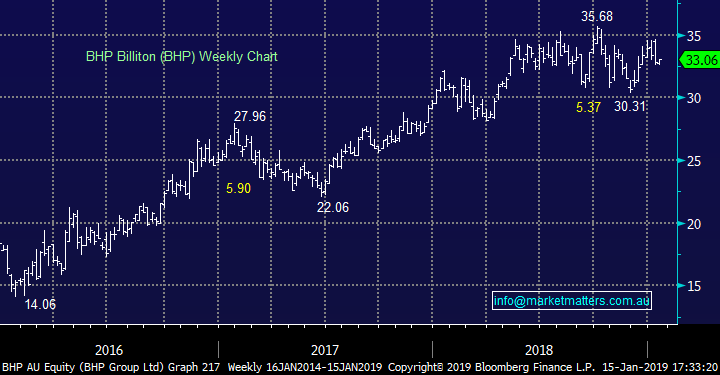
BHP Billiton (ASX:BHP) $33.06; BHP was very choppy in 2018 trading within a 25% range, but it’s now starting to reward patient investors with this month’s special dividend as they return capital to shareholders rather than plough it into the ground.
Overall our opinion has not particularly changed for the “big Australian” and we remain buyers under $30 but not chasers of strength.
BHP Billiton (ASX: BHP) Chart
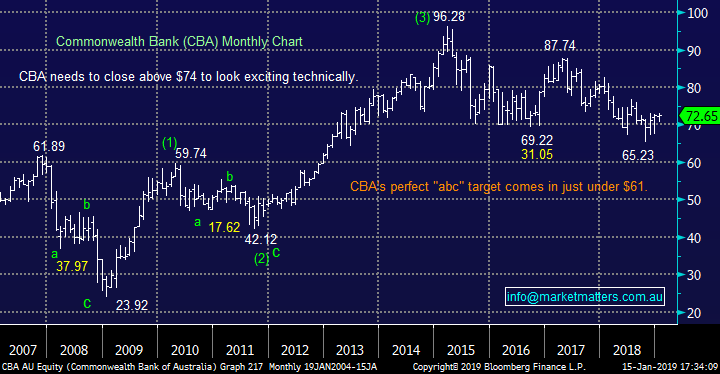
Commonwealth Bank (ASX:CBA) $72.65: CBA has bounced nicely from its late October low and we can see a test of ~$75 on the horizon, especially with Februarys attractive dividend looming.Overall we remain comfortably long CBA for now and we believe the banks are relatively cheap assuming Australia avoids a deep recession – note the word deep.
However considering our overall market view we will consider trimming our overweight banking exposure into ongoing strength to leave us an opportunity to re-enter at lower levels throughout the year.
Commonwealth Bank (ASX: CBA) Chart
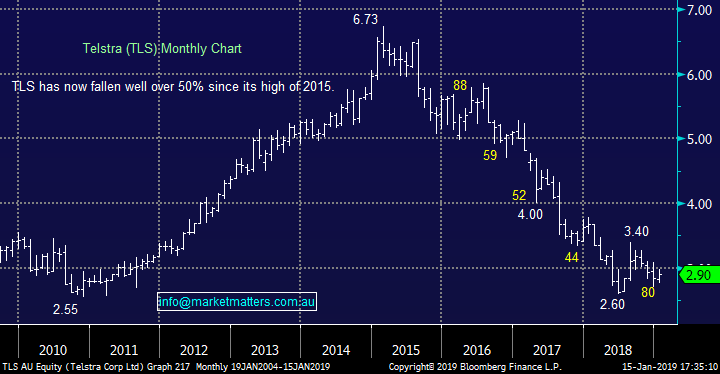
Telstra (ASX:TLS) $2.90; Telstra has unfortunately delivered so much pain to Australian investors over recent years that many will not consider our largest telco as an ‘investible stock’ however we think it’s time to do so. The opportunity in front of Telstra is a significant but challenging one (granted, it’s from a low base) and market positioning still remains negative on the stock. If equity market ‘chop’ in 2019 as we expect with the threat of recession in the background, Telcos usually outperforms in a weak market which adds to our comfort to buy into general weakness
MM is bullish Telstra medium term.
Telstra (ASX: TLS) Chart
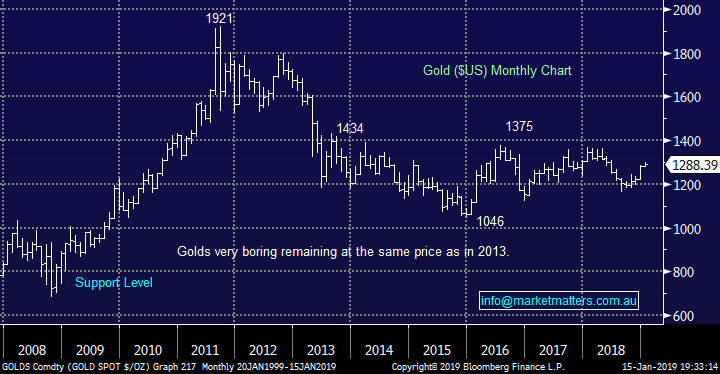
5 Time to watch gold
In $US terms gold has gone nowhere for 5-years although it has appreciated around 40% in $A terms, significantly helping the local miners outperform global peers. Over the last 12-months while the market has struggled gold stocks have rallied strongly – a move we’ve largely missed as we watched the precious metal more than the $A.
However we believe the $A is unlikely to offer the same tailwind this year that it did last year. Remember, out long held target for the AUD was 65c when it was trading above 80c, and we’ve seen a low now in the 67c handle implying that the bulk of the move has played out, while Gold itself is very 50-50 at best just here. We can see a decline in local gold stocks in Q1/2 and although there are no signs at present its a move we want to be prepared for.
We would be very interested buyers of gold stocks into decent weakness in 2019 – a sector where volatility should never be underestimated.
Gold ($US) Chart
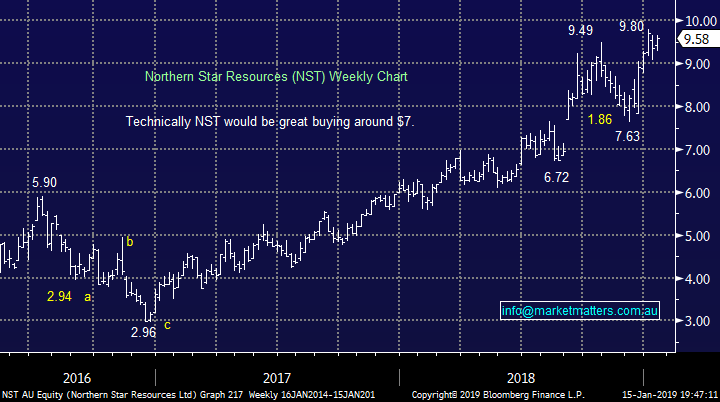
Over the last 2-years Northern Star Resources (NST) has been a great performer but it still corrected 20% in 2018.
MM is a keen buyer of NST into weakness below $8.
Northern Star Resources (ASX: NST) Chart
6 Three stocks MM likes ‘here and now’
This is always a tough one because identifying a great company with excellent prospects is usually only half the job, deciding the right price to pay for the stock is equally important e.g. CSL fell over 25% from its September high.
Rather than highlighting stocks we like at lower levels, today we look at 3 stocks I feel will perform well from current levels in a choppy market.
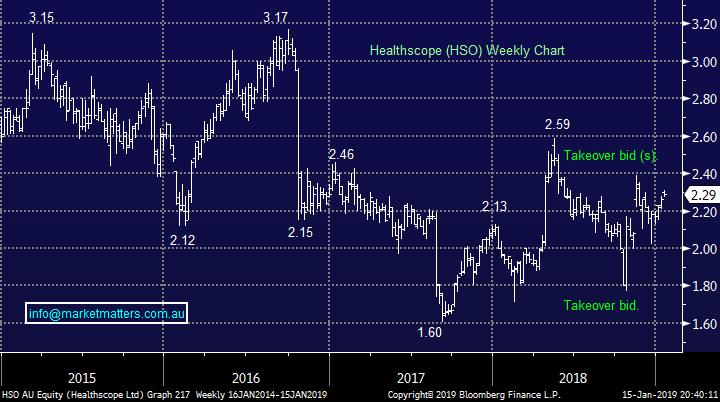
1 – Healthscope (HSO) $2.29; This is a call with one eye on capital preservation. There are 2 suitors for the hospital operator yet the stock continues to trade below the respective bids. We witnessed this week what BGH can / will do when they want something i.e. paying up further for Navitas (NVT).
We see little major downside but an excellent chance of 10%, or more, upside, which is ok in this market.
We like Healtscope as a situational play around here
Healthscope (ASX: HSO) Chart
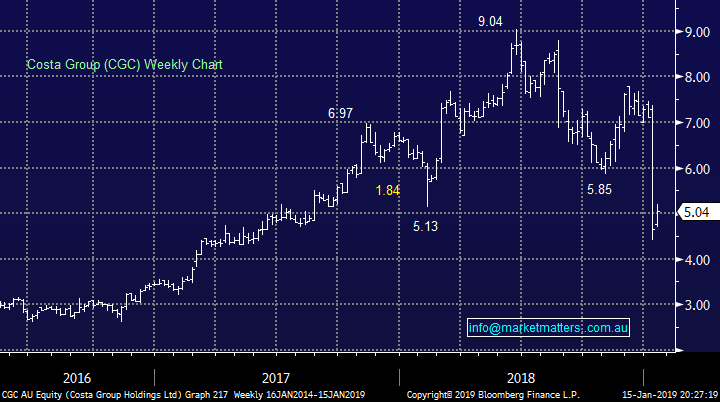
2 – Costa Group (CGC) $5.04; CGC through its subsidiaries grows and markets fruits and vegetables to supermarkets / independent grocers worldwide. Last week they downgraded earnings substantially due to some seasonal factors (i.e transient).
Following its 25% correction we like CGC especially its business model if the economy struggles i.e. food is fairly recession proof.
We like Costa around $5.00
Costa Group Holdings (ASX: CGC) Chart
3 – Telstra (TLS) $2.90; As discussed earlier we like TLS here but barring any surprises we can see $4 before $2 which provides solid risk / reward when fully franked dividends are included.
We like Telstra below $3.00
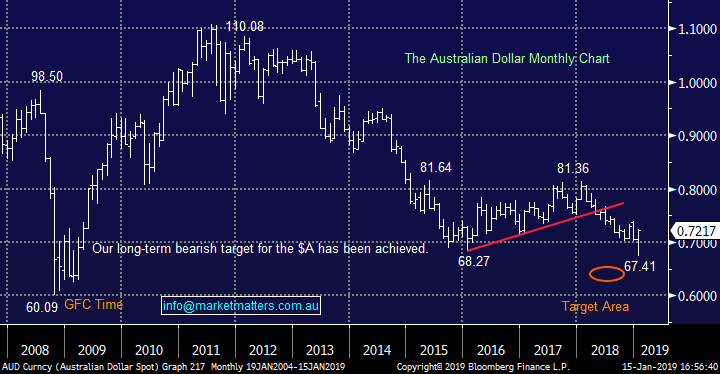
7 The Aussie Dollar $A
We believe the $A has reached, or is very close to the end of its 8-year decline. Another test below 67 just to reignite the bearish calls would not surprise us. The largely embraced buying of $US earning stocks is slowly but surely becoming long in the tooth and we believe the “go to” huge local outperformers like CSL, Cochlear, Computershare and Ansell should steadily become a smaller part of an investors’ portfolios.
We believe the tailwind of a weaker $A can no longer be relied upon by Australian investors.
Australian Dollar Monthly Chart
8 The macro-economic picture remains a concern
Global bond markets are usually regarded as the largest, most liquid and the “smartest” of all markets and subsequently investors should take heed when they generate strong signals. Currently, bond markets are signalling a recession on the horizon. Corporate earnings fall during a recession and analysts will look to get ahead of the curve. This implies that current earnings estimates will be cut and considering our market is currently trading on ~14.5x, there definitely remains room for a further re-rate lower.
We also track credit spreads which is the additional margin demanded by the market to hold risker bonds over and above safe Treasuries, and while credit spreads are not yet blowing out, they have widened through the recent market decline, particularly in corporates exposed to the energy sector.
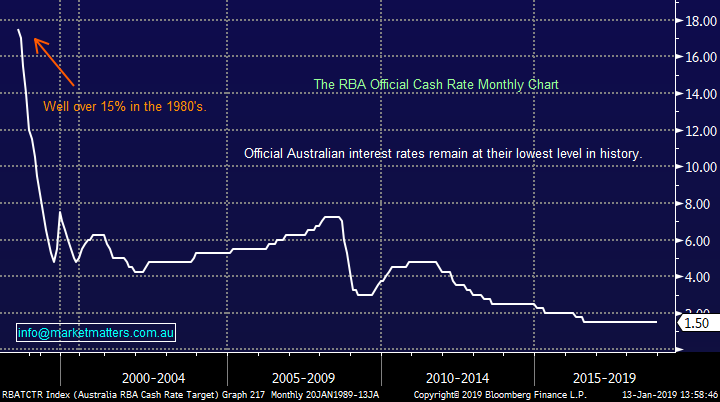
Locally, we now have the cash rate futures for next year predicting an RBA rate cut which clearly dovetails into the bond markets expectation of a global recession on the horizon. I doubt a rate cut will happen however if our economy takes a meaningful backward step, it remains a possibility. Other economies are struggling and this is being shown through weaker economic statistics – last week for instance saw a decline in Chinese car sales for the first time in over 20-years, while broader trade data has been soft – clearly the worlds growth engine is slowing with or without a trade war.
RBA Target Cash Rate Monthly Chart
The growth in China helped Australia avoid a recession during the GFC and it’s now impressively 28-years since we experienced two consecutive quarters of negative growth i.e. a recession. We continue to believe these economic risks are very real and we anticipate regularly favouring a more conservative investment stance in 2019.
Market sectors that generally perform best during a recession are usually reliable dividend payers like Utilities and Real-estate, Telecom plus Consumer Staples while growth stocks typically struggle.
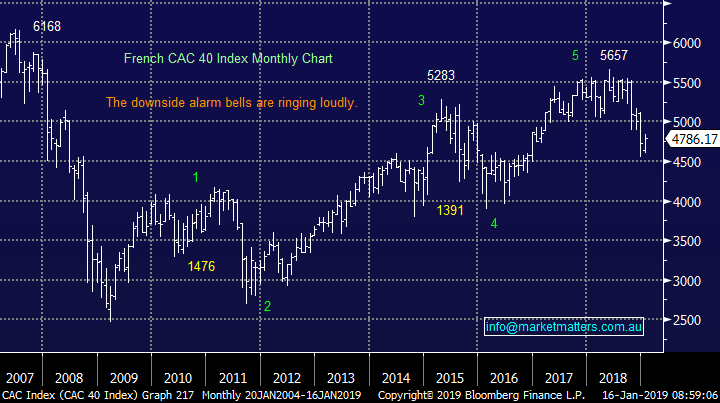
9 Avoid European facing indices / equities.
The ASX 200 is far more correlated to European Indices than it is to US Indices, using the French CAC for example highlights this fact well and unfortunately for Australia, European Indices look set to struggle further. While there is a lot of moving parts currently playing out in Europe, the technical picture targets a more bearish outcome for Europe in 2019. While European indices will enjoy strong bounces along the way we are bearish the French CAC targeting at least another 15% downside.
We continue to believe that the European Union’s days are numbered with the trigger likely to come from left field as is so often the case – this morning’s failed vote on BREXIT suggests there are more twists in the saga to play out.
French CAC 40 Index Chart
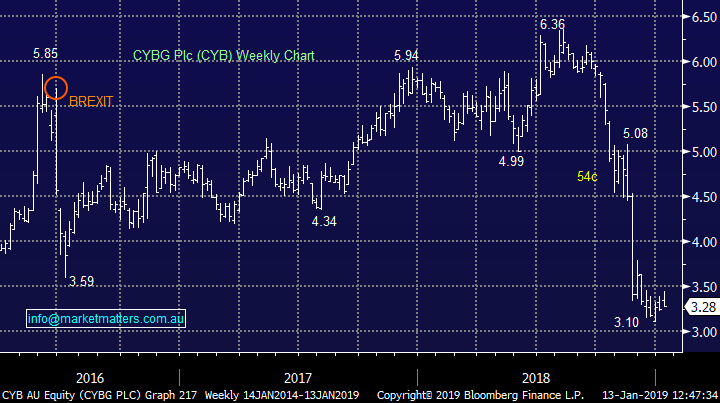
It comes as no surprise that one of the worst performing stocks on the local market last year was UK based CYBG Plc (ASX: CYB) which plunged around 40% - fortunately we sold our position for a good profit earlier in the year.
We remain cautious European exposed stocks and will give them a wide birth in 2019, including CYBG.
CYBG Plc (ASX: CYB) Chart
10 Cut losses & run profits
Constant self-evaluation is vital for all investors and especially a service like Market Matters. My key takeaway to apply in 2019 is further tighten up Money Management as markets potentially ‘tap out’ of this decade long bull market. As markets become more choppy, pullbacks will be deeper and more protracted. Cutting losses when stocks fail to perform as expected will be key, and this will be a focus for MM in 2019.
Last year, while the index slipped less than 3% after dividends we saw 13 stocks in the top 200 fall by over 40% and 14 rally by the same degree– this number is huge and doesn’t even consider intra-year swings. It’s also a fascinating scorecard in a falling market illustrating that running profits can be as important as cutting losses. Interestingly these numbers show the correct money management may lead to more activity however that doesn’t make you a trader. In a choppy market, more activity can actually be a more conservative strategy!
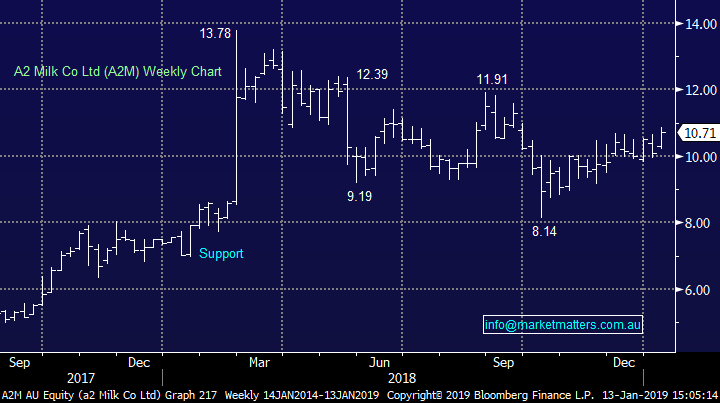
A good example of this was A2 Milk (ASX: A2M), where MM enjoyed a number of profitable trades however we missed the huge rerating in early 2018 – ouch!
This year we anticipate at times taking part profits, more frequent but smaller losses while continuing to scale into positions when deemed appropriate.
A2 Milk (ASX: A2M) Chart
Conclusion
While markets are throwing up challenges, 2019 will clearly be another year of opportunity where great companies will make great profits for investors. Identifying them, and importantly when to own them is our job which we work hard on each day. At the overall market level, I’m expecting (and are preparing) for a choppy year in 2019 as markets consolidate the deep December correction. At this point in time markets are grinding higher, however I firmly believe that using current strength to improve flexibility, increase cash and preparing for more choppy action in the months ahead makes sense.
We trust you enjoyed this year’s outlook piece. Importantly, markets are fluid and we update our views regularly through our daily notes, each Sunday in our Weekend Report while we send email & SMS alerts when we transact on our portfolio.
All the best for 2019
James & the Market Matters Team
Disclosure
Market Matters may hold stocks mentioned in this report. Subscribers can view a full list of holdings on the website by clicking here. Positions are updated each Friday, or after the session when positions are traded.
Disclaimer
All figures contained from sources believed to be accurate. Market Matters does not make any representation of warranty as to the accuracy of the figures and disclaims any liability resulting from any inaccuracy. Prices as at 16/1/2019
Reports and other documents published on this website and email (‘Reports’) are authored by Market Matters and the reports represent the views of Market Matters. The MarketMatters Report is based on technical analysis of companies, commodities and the market in general. Technical analysis focuses on interpreting charts and other data to determine what the market sentiment about a particular financial product is, or will be. Unlike fundamental analysis, it does not involve a detailed review of the company’s financial position.
The Reports contain general, as opposed to personal, advice. That means they are prepared for multiple distributions without consideration of your investment objectives, financial situation and needs (‘Personal Circumstances’). Accordingly, any advice given is not a recommendation that a particular course of action is suitable for you and the advice is therefore not to be acted on as investment advice. You must assess whether or not any advice is appropriate for your Personal Circumstances before making any investment decisions. You can either make this assessment yourself, or if you require a personal recommendation, you can seek the assistance of a financial advisor. Market Matters or its author(s) accepts no responsibility for any losses or damages resulting from decisions made from or because of information within this publication. Investing and trading in financial products are always risky, so you should do your own research before buying or selling a financial product.
The Reports are published by Market Matters in good faith based on the facts known to it at the time of their preparation and do not purport to contain all relevant information with respect to the financial products to which they relate. Although the Reports are based on information obtained from sources believed to be reliable, Market Matters does not make any representation or warranty that they are accurate, complete or up to date and Market Matters accepts no obligation to correct or update the information or opinions in the Reports. Market Matters may publish content sourced from external content providers.
If you rely on a Report, you do so at your own risk. Past performance is not an indication of future performance. Any projections are estimates only and may not be realised in the future. Except to the extent that liability under any law cannot be excluded, Market Matters disclaims liability for all loss or damage arising as a result of any opinion, advice, recommendation, representation or information expressly or impliedly published in or in relation to this report notwithstanding any error or omission including negligence.