Reviewing the MM Growth Portfolio
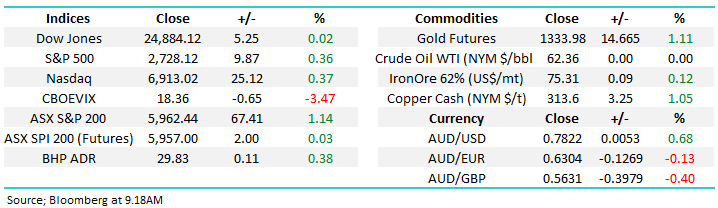
The ASX200 had an impressive bounce yesterday closing up 67-points with strength across the board but some heavyweight miners and the telco’s caught our eye e.g. Alumina (AWC) +4.8%, OZ Minerals (OZL) +2.3% and Vocus (VOC) +6.2% . With the Dow oscillating around unchanged this morning the local market looks well positioned to add to these gains but in a more subdued manner i.e. BHP is trading up +0.6% this morning in the US.
MM remains bullish the ASX200 through March and April targeting the 6250 area, or around 5% higher.This positive short-term outlook will be confirmed from a technical perspective if / when the ASX200 can make fresh highs for March, back above 6020.
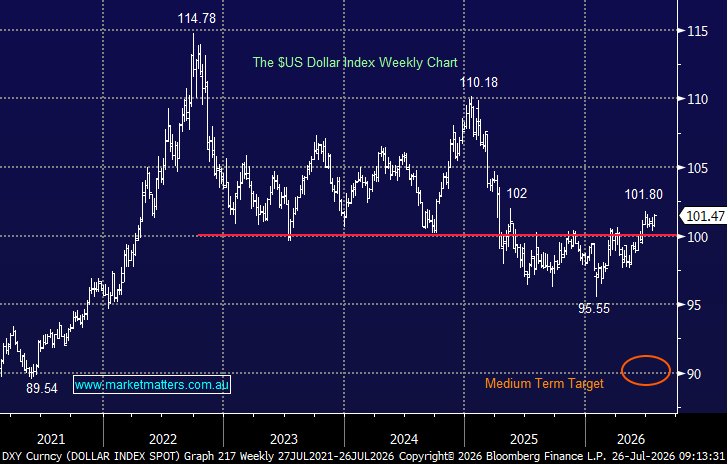
We were very encouraged to see the $US turn lower overnight and our target back under the 88 level still looks in play, a fall of about 2% - a lower $US has been strongly correlated with higher equities, led by the resources, since early 2017. Perhaps market players are giving the thumbs up to the Chinese olive branch on free trade plus North Korea’s about face on nuclear discussions and the classic colosseum thumbs down to Donald Trump’s tariffs.
Today’s report is going to focus on the MM Growth Portfolio as we are wearing our sellers hats looking for strength to significantly increase our cash position.
Local Index
Yesterday the ASX200 soared +1.14% yesterday as it embraced the +300-point bounce by the Dow. For the mathematicians out there the SPI Futures (basically the ASX200 taking into account dividends) are forming a perfect normal distribution / Neutral Pattern from 5691 to 6072, if we get a break over 6072 from a trading perspective we could be buyers with stops under 6020.
This morning the SPI futures are implying an ASX200 open ~5970, as we said above we remain bullish the ASX200 targeting 6250-6300 area.
ASX200 Chart

ASX200 March SPI futures Chart

US Stocks
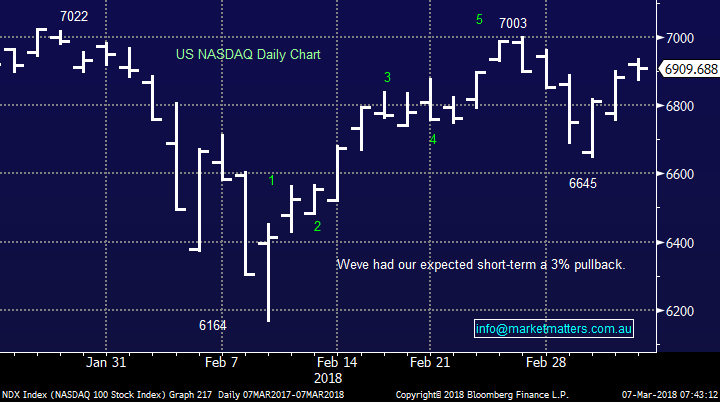
No real change, US stocks experienced the ~3% pullback we flagged last week and ideally are in the process of commencing a rally to fresh all-time highs – the high flying NASDAQ which we believe regularly leads global indices is currently only 1.6% below its all-time high – pretty good effort considering what’s been thrown at it since February e.g. rallying bond yields, a volatility implosion and Donald Trump threatening trade wars.
NB Also, the S&P500 made fresh highs for March last night, a statistically very bullish indicator.
US NASDAQ Chart
The MM Growth Portfolio
We have split up our holdings by sectors in our discussion below simply because at MM when we look at stocks we start with the market, followed by the sector and then finally the stocks themselves – we have covered our market view above which has remained pretty consistent for the last 2-years.

1 Resources
We have 6 stocks in the sector, for a 21% portfolio exposure, the majority of which we purchased when global stock markets slumped in February:
- Alumina (AWC), RIO Tinto (RIO), OZ Minerals (OZL), Kidman Resources (KDR), BHP Billiton (BHP) and Woodside Petroleum (WPL).
We look at 2 highly correlated markets to help us forecast where the resources sector is heading:
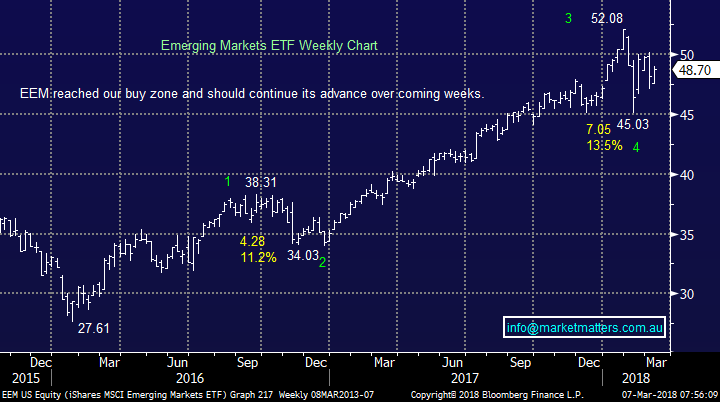
- The Emerging Markets rally very much in sync with our resources sector and we still anticipate them making a fresh highs for 2018, around 8-10% higher – a bullish tick.
- The $US Index is inversely correlated to our resources sector, especially day to day, which makes sense as the underlying commodities are priced in $US e.g. last night the $US fell -0.5% and gold rallied +1.2%. We remain mildly bearish the $US, another bullish tick.
Hence combining the above 2 points with our short-term bullish for stocks we remain sellers of strength, not weakness until further notice.
Emerging Markets ETF Chart
$US Index Chart

Our current sell targets for our 6 holdings are:
- Alumina (AWC) $2.39 – AWC recently traded ex-div. US9.3c fully franked div. but at this stage we are looking for fresh 2018 highs towards $2.65-2.70, around 10% higher.
- RIO Tinto (RIO) $76.09 – RIO recently traded ex-div. $2.29 fully franked dividend, ideally we are targeting the $80-$82 region.
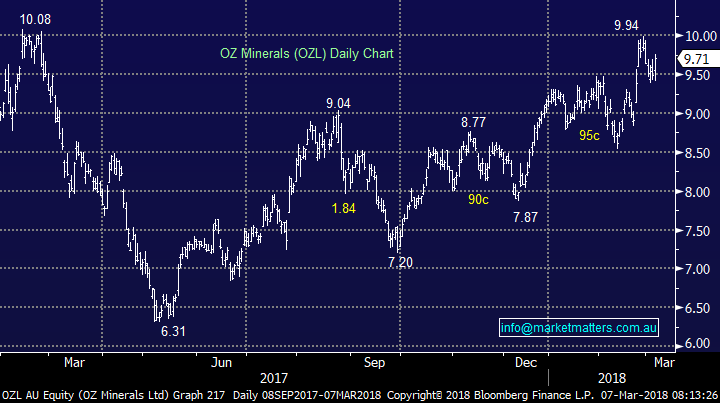
- OZ Minerals (OZL) $9.71 – OZL trades ex-div. on Friday paying 14c fully franked, we are still targeting around $10.30.
- Kidman Resources (KDR) $1.97 – we are still targeting the $2.25-2.30 region, around 15% higher.
- BHP Billiton (BHP) $29.72 – BHP trades ex-div. US55c fully franked tomorrow, our ideal target remains above $32 but President Trump has put pressure on the “Big Australian” with his tariff speech.
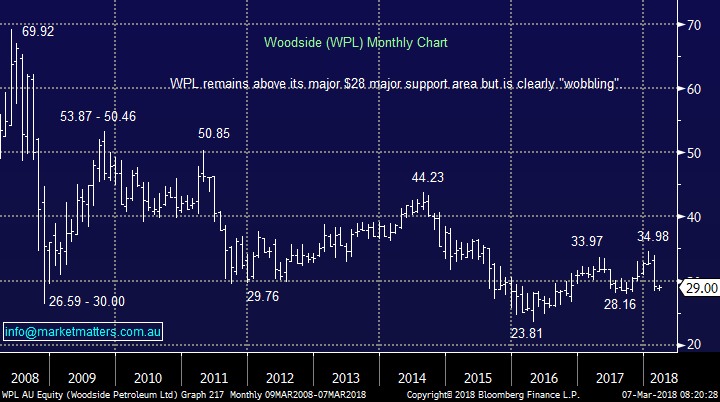
- Woodside Petroleum (WPL) $29 – WPL recently traded ex-div. US49c fully franked div. last month, the stock has been under pressure since the rights issue and we will now be happy to exit ~$31. We have taken up our rights at $27 in WPL
The below charts show what looks to be the first profit target that will be reached (OZL) and the worst position at present (WPL).
OZ Minerals (OZL) Chart
Woodside Petroleum (WPL) Chart
2 Banks
We have 5 stocks in the sector, for a 33% portfolio exposure, the majority of which we have held since 2017 accumulating some healthy dividends in the process:
- Macquarie Group (MQG), Clydesdale Bank (CYB), Commonwealth Bank (CBA), Westpac (WBC), National Australia Bank (NAB).
We have covered how bullish the next 6-weeks is for banks and this will probably dictate much of our activity through to May e.g. on average over the last 10-years NAB has gained +8% only to then fall -7.5% through May / June.
We have no specific targets for each bank holding at this stage and will be dictated more by our view of the ASX200 at the time:
1. CBA traded ex-div. in February and NAB and Westpac are to follow in May. We are likely to significantly reduce our exposure to these 3 with Westpac probably our first sale.
2. Macquarie Group (MQG) $103.57 – at this stage we can see ourselves taking profit on MQG around $109.
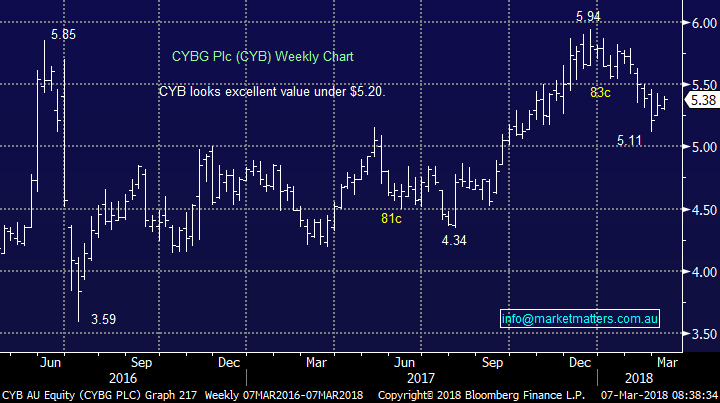
3. CYBG (CYB) $5.38 - at this stage we remain optimistic on CYB targeting the $6 area.
NB The key takeout is banking exposure is likely to fall from 33% to well under 20% if markets unfold as we expect.
Australian Banking Sector Seasonality Chart

CYBG Plc (CYB) Chart
3 Financials
We have 4 stocks in the sector, for a 29% portfolio exposure, the sector is undoubtedly where we have the 2 most frustrating positions at this point in time and as such it’s the place the broom may be most active in March / April:
- Janus Henderson (JHG), IOOF Holdings (IFL), QBE Insurance (QBE) and Suncorp (SUN).
Our current stance on each holding;
- Janus Henderson (JHG) $44 – JHG has rapidly fallen from a good position to become a poor one as Europe struggled overall, we are now sellers around $47.
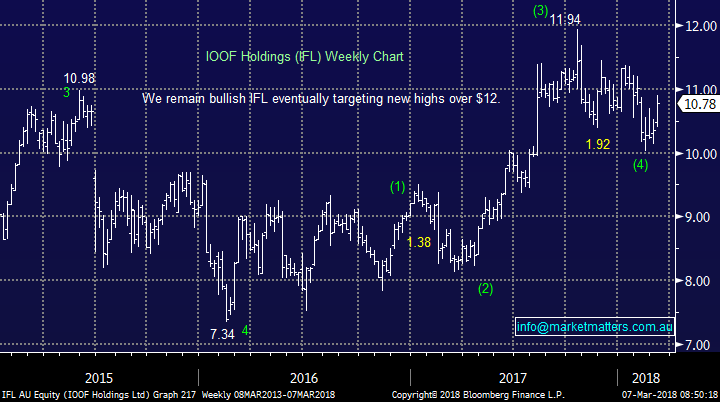
- IOOF Holdings (IFL) $10.78 – IFL recently traded ex-div. 27c fully franked, our target remains around the $12 area.
- QBE Insurance (QBE) $9.90 – QBE trades ex-div. 4c part franked tomorrow, we have persisted with QBE for macro reasons which have proved correct but the company has not performed on the corporate level. We like the stock ~$9.25 but are sellers around $11.50.
- Suncorp (SUN) $13.98 – SUN recently traded ex-div. 33c fully franked, our target remains around the $16 area but we are likely to lighten our position closer to $15.
IOOF (IFL) Holdings Chart
4 Tech / Telco
We have 2 stocks in the group for 8% of the MM Growth Portfolio plus our 9% cash holding:
- Webjet (WEB), Telstra (TLS) and cash.
Our plan is straightforward here but very different across the holdings:
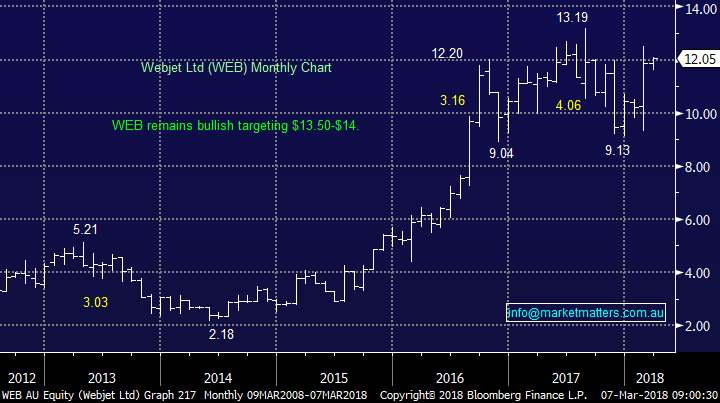
- Webjet (WEB) $12.05 – WEB trades ex-div. 8c fully franked at the end of this month, we continue to target $13.50-$14.
- Telstra (TLS) $3.37 – TLS has just traded ex-div. 11c fully franked at the end of February, we believe TLS will outperform in a difficult market environment, we are sellers around $3.80.
- Cash at 9% - We can see this increasing towards / over 50% in the coming 6-weeks.
Webjet (WEB) Chart
Conclusion
- We remain bullish stocks into April / May and intend to increase our cash levels fairly aggressively moving foirward.
- At this stage we will follow the plans outlined above..
Global markets
US Indices
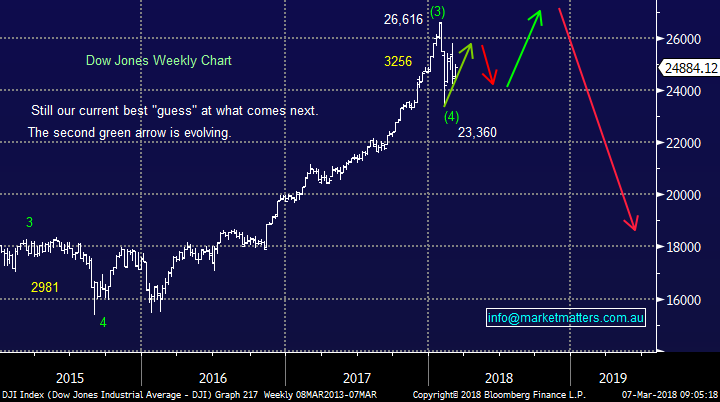
No major change, overall we believe US stocks have formed a low and they will be higher in 1-2 months’ time.
- While we expect US stocks to rally to fresh highs the likely manner of the advance is far more choppy / indecisive than the almost exponential gains we have witnessed from late 2016.
US Dow Jones Chart
European Stocks
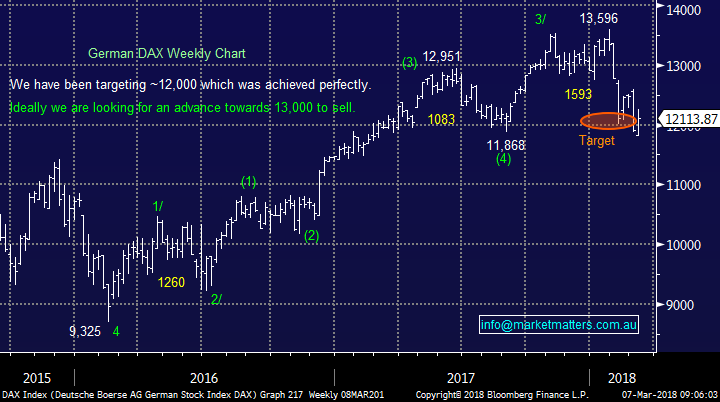
European indices have been lagging since late January but picked up over the last 48-hours, potentially we’ve seen their low for a few months.
German DAX Chart
Asian Stocks / Emerging Markets
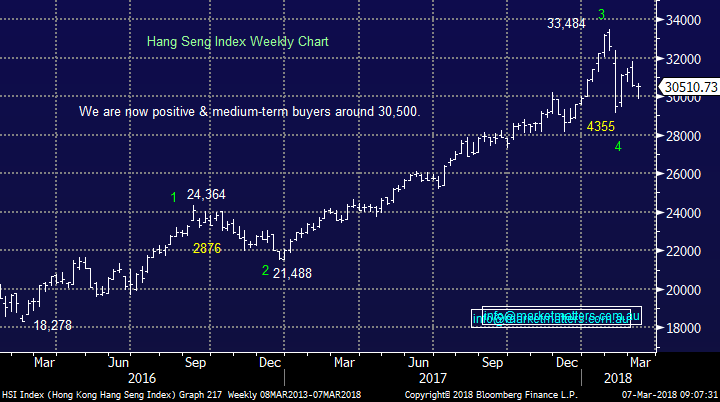
We remain bullish the Hang Seng at current levels ideally targeting fresh 2018 highs in the next ~4-6 weeks – also this adds weight to our preferred scenario that the $US can see one final low in the coming weeks.
Hang Seng Chart
Overnight Market Matters Wrap
· US equities were steady overnight as continued commentary surrounding proposed tariffs injects renewed uncertainty into the market. A Goldman Sachs critique of the proposed policy has reiterated that the tariffs will ultimately hurt US trading allies, creating a two-tiered global marketplace
· The RBA kept the cash rate on hold at 1.5% as expected, so attention now turns to Phillip Lowe’s speech this morning at the AFR summit. GDP data is due out at 11:30AEDT, with consensus numbers indicating the economy grew by 0.6% in Q4, with consumption growth offsetting weaker net exports.
· The $A rose back through 78c, up 0.6% as Capital Economics revised up its yearly target for our currency to US$0.75, on the back of a lack of reaction to the divergence in monetary policy. The next Fed movement to 1.75% will be the first time since 2001 that the US cash rate is higher than Australia’s.
· Iron ore continued its decline, dropping 1.2%, however both BHP and RIO were closed higher in US trading, each recording gains of more than 2% with BHP in the US ending its session up 0.38% to $29.83 from Australia’s previous close.
· The March SPI Futures is indicating the ASX 200 to open marginally higher, up 7 points testing the 5970 level this morning.
Disclosure
Market Matters may hold stocks mentioned in this report. Subscribers can view a full list of holdings on the website by clicking here. Positions are updated each Friday, or after the session when positions are traded.
Disclaimer
All figures contained from sources believed to be accurate. Market Matters does not make any representation of warranty as to the accuracy of the figures and disclaims any liability resulting from any inaccuracy. Prices as at 07/03/2018. 9.18AM
Reports and other documents published on this website and email (‘Reports’) are authored by Market Matters and the reports represent the views of Market Matters. The MarketMatters Report is based on technical analysis of companies, commodities and the market in general. Technical analysis focuses on interpreting charts and other data to determine what the market sentiment about a particular financial product is, or will be. Unlike fundamental analysis, it does not involve a detailed review of the company’s financial position.
The Reports contain general, as opposed to personal, advice. That means they are prepared for multiple distributions without consideration of your investment objectives, financial situation and needs (‘Personal Circumstances’). Accordingly, any advice given is not a recommendation that a particular course of action is suitable for you and the advice is therefore not to be acted on as investment advice. You must assess whether or not any advice is appropriate for your Personal Circumstances before making any investment decisions. You can either make this assessment yourself, or if you require a personal recommendation, you can seek the assistance of a financial advisor. Market Matters or its author(s) accepts no responsibility for any losses or damages resulting from decisions made from or because of information within this publication. Investing and trading in financial products are always risky, so you should do your own research before buying or selling a financial product.
The Reports are published by Market Matters in good faith based on the facts known to it at the time of their preparation and do not purport to contain all relevant information with respect to the financial products to which they relate. Although the Reports are based on information obtained from sources believed to be reliable, Market Matters does not make any representation or warranty that they are accurate, complete or up to date and Market Matters accepts no obligation to correct or update the information or opinions in the Reports.
If you rely on a Report, you do so at your own risk. Any projections are estimates only and may not be realised in the future. Except to the extent that liability under any law cannot be excluded, Market Matters disclaims liability for all loss or damage arising as a result of any opinion, advice, recommendation, representation or information expressly or impliedly published in or in relation to this report notwithstanding any error or omission including negligence.
To unsubscribe. Click Here