Subscriber Questions (MQG, BOQ, IVX, MIN, AGO, MMI, TLS)
The news flow over the weekend was obviously dominated by the attack on Syria by the U.S, UK and France where 100 missiles were fired at Syrian targets in response to a Chemical attack. While this is a sad humanitarian issue we expect the market to take this in its stride assuming Russia sits on its hands.
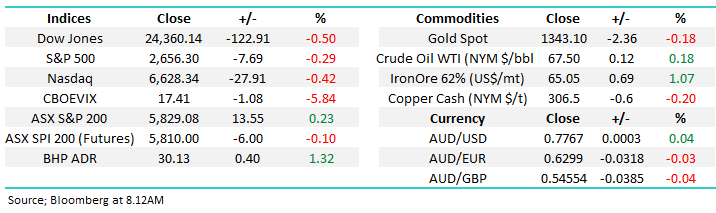
For now we retain the view that stocks are now trying to rally / looking for a low and from a trading perspective we would be buyers of any fresh lows towards the 5700 area by the ASSX200. A similar scenario is playing out in the U.S with major indicies attempting to rally.
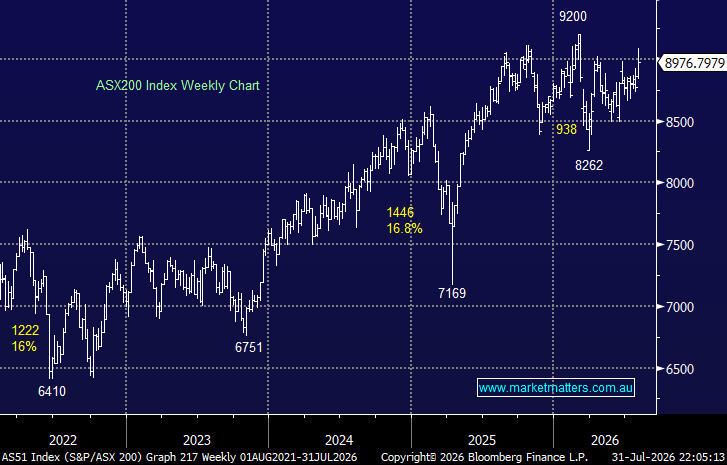
ASX 200 Chart
We have received a big volume of questions this week and I have answered many of them this morning. Please keep them coming!
Question 1
Hi James. Don't believe what the media is broadcasting on Syria. Check with the head doctor of the only hospital in the area where the reported chemical attacks occurred. He said it didn't happen, or tune into the many investigators who have visited the area and talked to the people. There are many war mongers in the West on both sides. I hope Trump doesn't fall for it. The real underlying issue is a complex one of an energy pipeline planned to run through Syria to Turkey and into Europe as well as the Russians wanting to maintain warm water access to the Mediterranian and the Indian Ocean, Thus, Iran. The Israeli's are heavily involved - Peter
Thanks for sharing your views Peter. Like all of us, I’m simply reading & pondering the news around the Syrian situation with my main focus on how the market may react and whether or not we should be changing our stance. Using history as a guide, these sort of events are a slight negative to the market however if it doesn’t escalate and importantly, Russia keeps its cool then we doubt this situation will be any different.
Question 2
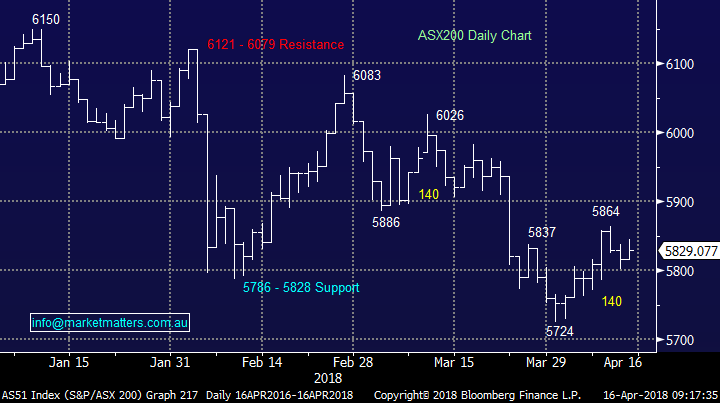
Hi Please tell me more about the SPI futures. Friday 13th your morning note said the SPI futures were up 18 to 5815. ASX close Thursday 12th was 5815. Bloomberg data at 0740. My Bloomberg TV lower banner at 0755 after US market close said SPI futures were 5815 down 13. Up and down compared to what? Seems the futures are not as reliable an indicator of the ASX these days - what do you think? - Frances
Morning Frances – a very good question. In short, the SPI Futures and the cash market (XJO) follow the same daily directions given they are based on the same thing – the weighted average of the top 200 stocks on the Australian market. The main difference is that the SPI is a forward looking contract and therefore it runs at either a premium or a discount depending on traders views of where prices are headed. If the market is in bear mode the SPI will likely trade at a discount while in bull mode it will likely trade at a premium. We use the SPI a lot in formulating our views of the market and making decisions day to day. Basically, the SPI is an instrument used to bet on forward prices and because of that, on a day to day basis the SPI tends to lead the cash given it’s forward looking.
From my days on an institutional dealing desk, if I had a large basket of stocks to buy from an overseas fund, I would buy the SPI given its liquidity to gain the market exposure then back fill the individual stock lines. If I had a large sell order then I would short the SPI, however bear in mind that the SPI is simply a price based on the collectives view and that view that view can go from bearish to bullish and back again pretty quickly. You’re right, in recent times the SPI has not been picking the day well with the US Futures that come online each morning having more of an influence.
SPI Futures 60 minute chart
Question 3
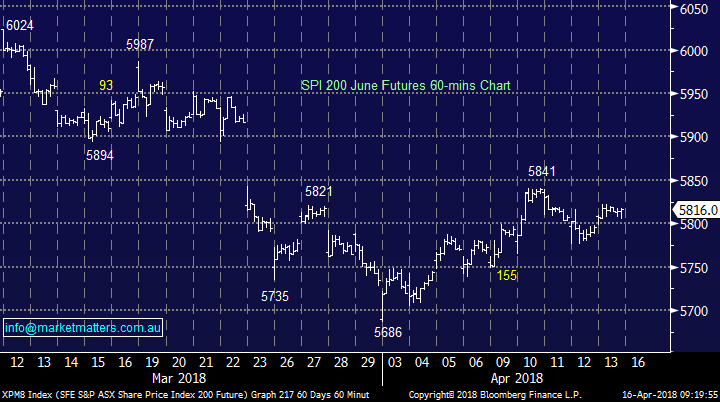
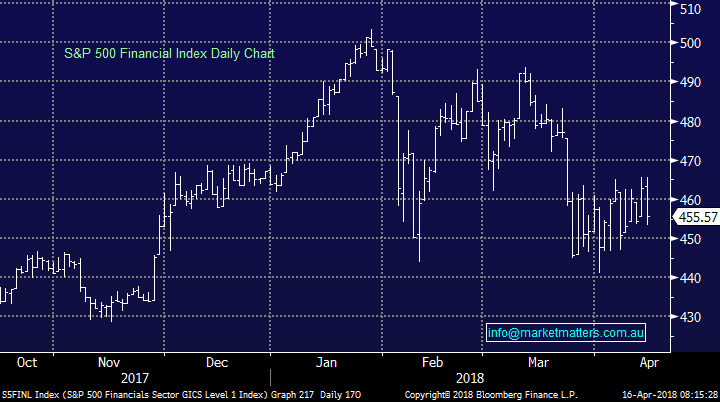
Hello. I have been watching the Diversified Financials sector for some months now (for buying opportunities), and it continues to fall. Could they be the big losers in the Bank RC, short to medium term. I would be interested in your insight regarding the forces behind this trend, and what its future looks like. - Regards Darryl
Thanks Darryl – you’re certainly correct in saying they’ve been incredibly weak in recent times and the Royal Commission will likely have an impact on the sector when the focus is turned towards financial planning and other forms of advice that the wealth managers are exposed to, however the weakness in the local sector has not been isolated, the diversified financials in the US have also been weak. It’s an area of the market that is extremely leveraged to financial conditions. When optimism is high and the market is performing well, stocks in that area do really well, and when conditions are less certain they do poorly. Just like the SPI Futures look forward, I think the diversified financials are a bell weather to the markets future views – and right now, the sector is highlighting some potential clouds on the horizon. In the MM Growth Portfolio we hold IFL, JHG and Macquarie. JHG and IFL have been weak while Macquarie has been strong. We’re now looking to sell any 5% advances in JHG and IFL, while we like Macquarie more given its international earnings.
Sell strength rather than buy weakness in the diversified financials until further notice
ASX 200 Financial Index Chart
US Financials Index Chart
Question 4
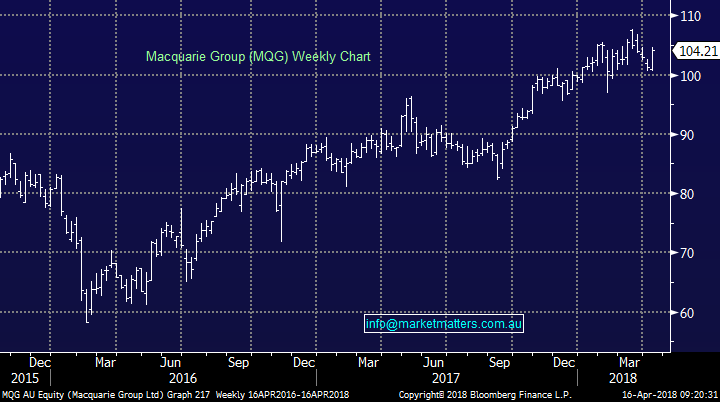
Apologies for this question but I can’t find your last advice on MQG.Is MM holding onto MQG or selling. If the latter at what price? - Chris
No worries Chris – we have 3% of the MM Growth Portfolio in Macquarie from $98.23 with the position currently showing a paper profit of 6.09%. We are targeting the $110 area.
Macquarie (MQG) Chart
Question 5
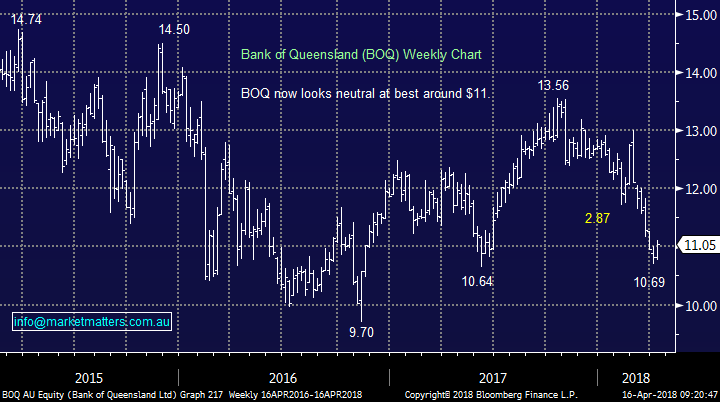
Hi Market Matters, love your work, BOQ is coming up for a dividend distribution very soon and like the other banks has tanked in its share price, would it be a good idea to invest for dividend stripping?? thank you
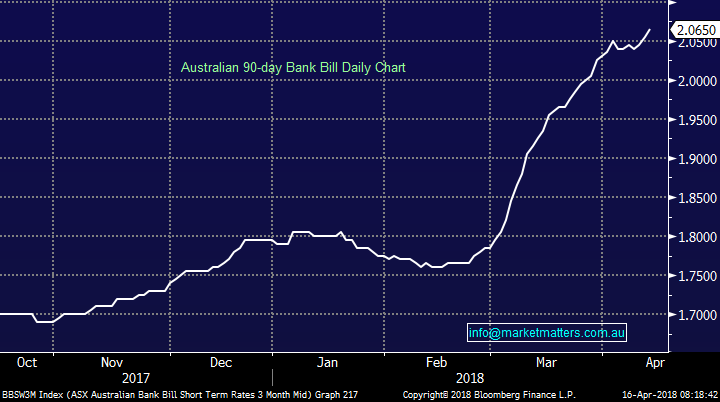
Bank of QLD (BOQ) reports its half year earnings on the 17th April (for the half year ended on the 28th Feb) and then goes ex-dividend on the 3rd May. The market is expecting a dividend of 39c for the half which puts BOQ on a full year projected yield of 7.60% fully franked, which is clearly attractive in a low interest rate environment. Like all the banks, BOQ has been weak although the regionals have suffered more in recent times than the majors for a few reasons. BOQ is the highest yielding bank in the sector and from that perspective it looks compelling, however we’ve stayed away from the regionals in recent times simply because their metrics are weaker yet they’ve traded on a similar PE multiple to the big 4 which have suffered from the royal commission.
The other main issue for the regionals has been rising short term interest rates in the wholesale market. The regionals are more exposed to external funding sources than the majors and the chart of the 90 bank bill rate highlights this theme – it also means that interest rates on mortgages will be going up.
90 Day Bank Bill Rate
We like the banks here, and have exposure to them, however we’ve got a clear preference for the majors. ANZ, NAB & Westpac also go ex-dividend in May (in that order)
Bank of QLD (BOQ) Chart
Question 7
Hi Guys, A question for your Monday email- Can you please explain your charts below from your AM report yesterday? What do all the numbers 1, 1/, (1), 2, 2/, (2) mean? Also, what are your thoughts on Chorus (CNU), NZ’s version of the NBN? - Thanks, Richard
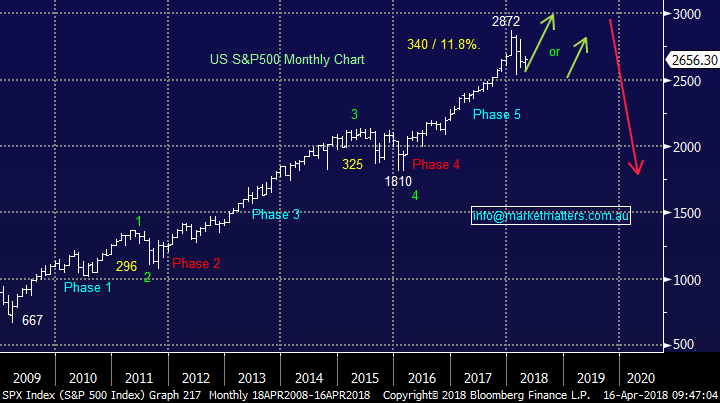
At MM, we combine a number of techniques and tools like Distribution Theory, Wave Analysis, DOT Theory, Statistics, Pattern Recognition, Fundamental research. The numbers outlined above are part of our wave analysis (a combination of wave equality and Elliot Wave) for pattern recognition on the trend of the underlying stock or index. Click here for a basic introduction, but be wary as this is only one part of our stock picking / analysis process.
Using the S&P 500 as an example, our reading is that we’re in a final 5th phase of the current bull market, which can often be a very explosive phase however it clearly suggests that a major market top is close.
S&P 500 Chart
Question 8
Hi James and team
Really enjoy your insights. The difficulty is picking when there are more than I can “handle”
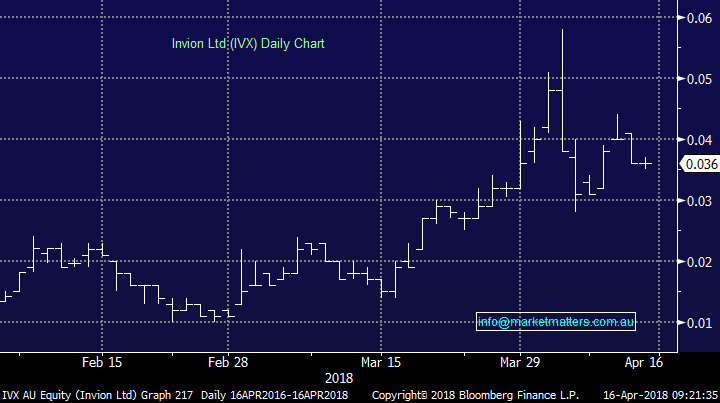
I own some shares in IVX which has done really well recently and now owes me nothing. I may have sold off shares a bit early and I find the chart quite interesting. Because the movement has been so sudden, is it still possible to draw wisdom from the chart. It did seem to get ahead of itself and sold off, but now consolidating again. I would value your insights.
Thanks
Kind Regards,
Peter
Thanks Peter – you’ve certainly gotten onto a good little biotech which has done exceptionally well in recent times. Without ever owning the stock, we can simply comment technically and the chart looks strong with the stock rallying on strong volume, before correcting on lower volume. Applying a stop loss on a close basis under 3c and giving the position some room to move here looks a worthwhile approach. NB the company has recently raised money and given there are now 5.5b shares on issue a consolidation of the share capital would be the next logical step for the company.
Invion Limited (IVX) Chart
Question 9
James, Your reports are certainly good for my intellectual health, which is imperative to a Senior Australian, drawing a meagre State Pension and in charge of an SMSF ! However, I am still shaky ( mentally that is!) on whether I am exempt from labor's Franking credit proposals. Any simple explanation would make an old man even happier!! - Bruce
Thanks Bruce – under the amendments put forward by Shorten following considerable back lash, it now seems likely (and it’s important to get your own advice here) that anyone drawing a full or part Government Pension will be exempt.
Question 10
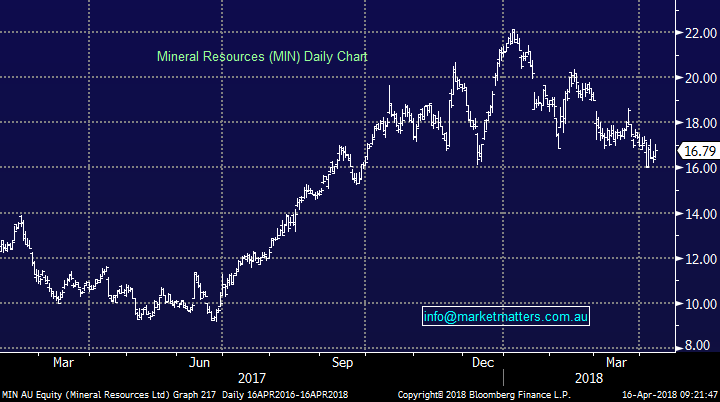
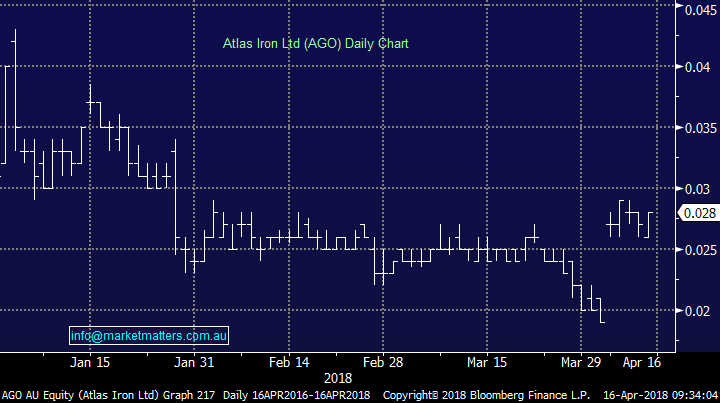
Hi, just wondering what you think about the ago acquisition? I am considering selling my holding in AGO today. Thanks
Peter Thompson
Hi Peter – this is an all share offer from Mineral Resources for Atlas Iron so AGO is now a proxy for the Mineral Resources share price. Based on the ratio of 571 AGO shares for every 1 MIN share, AGO should theoretically be trading at 2.9c versus the last close price of 2.8c. MIN has good support at $16 however we’re short term bearish the stock particularly given they recently downgraded production numbers but upgraded price realisation meaning a nett neutral outcome, however it highlights some production related issues might be bubbling away.
Mineral Resources (MIN) Chart
Atlas Iron (AGO) Chart
Question 11
Hi MM,
Thanks very much for all your help in these uncertain times.
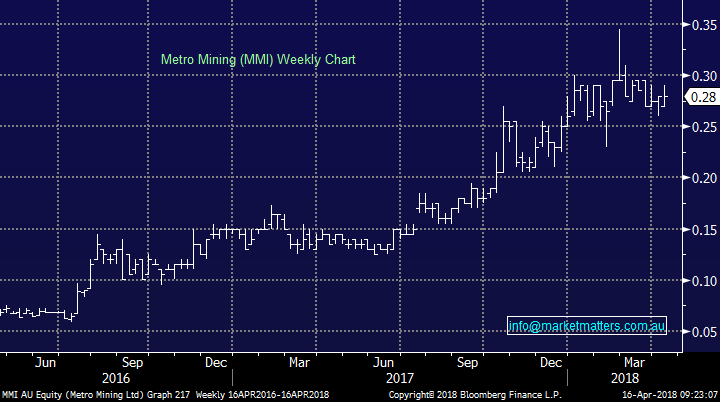
You might consider MMI, because they have MM in their code they must be pretty good.
Actually they have been reasonably stable whilst other bigger names have failed, and now that the cyclones have gone all they gave to do is start shoveling bauxite out the door.
Regards Phil.
Thanks Phil – a Thermal Coal and Bauxite miner based in QLD with a market capitalisation of $360m that has been doing well as you suggest. A bit too small for us in terms of liquidity I’m afraid
Metro Mining (MMI) Chart
Question 12
G'Day again, Given that you paid $100 for the above, would you recommend their purchase now that they are below $100???
Will the 3.4% (for now) return be fully franked if Mr. Shorten gets a turn?
Waz
Hi Waz – We were happy to buy the CBA Hybrid for the Income Portfolio on a margin of 3.40% over the bank bill rate and now the note is trading at a margin of 3.57%. Nothing has changed, we’re happy holdings given we think we think we’re been adequately paid for the risk in the security. The franking issue (assuming Shorten gets in) will be different for each person and their circumstances so hard for us to comment here.
Question 13
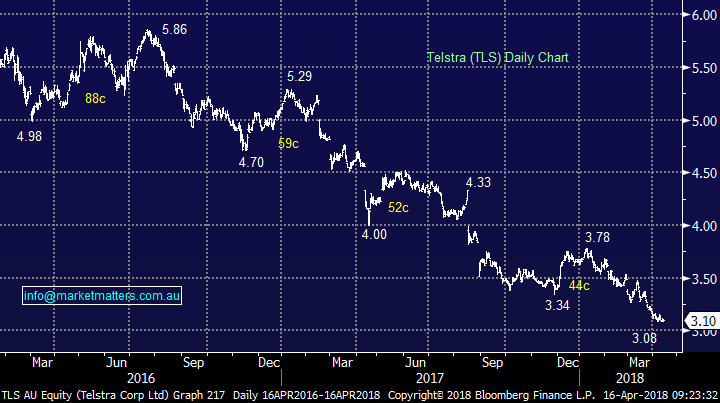
Hi James and team Thanks for your efforts. A question re TLS. On Monday you were positively going to buy under $3.10. The stock did go under $3.10 and stayed there for a short time yet you did not buy. Would you let us have your comments on why you failed to buy and probably more importantly why no alert was sent to NOT buy assuming the latter to be the case - Thanks FrankR
Hi Frank – you’re right, TLS came down to our level and we didn’t send an alert to buy. This comes down to a portfolio call given our low cash weightings at the time. Unlike many services, we run a real portfolio and our cash constraints were an issue here. If we did not own TLS we would have bought. In terms of alerts sent when we are ‘not’ buying something, I think that is a bridge too far.
Telstra (TLS) Chart
Overnight Market Matters Wrap
· The US majors closed lower last Friday, as investors reduced their risk exposure ahead of the weekend, only to see risk back on with the US Futures rallying 0.7% this morning (8.18AM)
· Metals were mixed on the LME, iron ore rose, and oil was better after the US led missile strikes on Syria. However we expect BHP to outperform the broader market today, after ending its US session up an equivalent of 1.32% from Australia’s previous close.
· Australian employment figures will be the focus later in the week (Thursday) while Chinese GDP and industrial production will be released tomorrow.
· The June SPI Futures last Friday is indicating the ASX 200 to open with little change, however we expect a positive open than what is expected, following the US Futures’ open this morning.
Have a great day!
James & the Market Matters Team
Disclosure
Market Matters may hold stocks mentioned in this report. Subscribers can view a full list of holdings on the website by clicking here. Positions are updated each Friday, or after the session when positions are traded.
Disclaimer
All figures contained from sources believed to be accurate. Market Matters does not make any representation of warranty as to the accuracy of the figures and disclaims any liability resulting from any inaccuracy. Prices as at 16/04/2018. 8.26AM
Reports and other documents published on this website and email (‘Reports’) are authored by Market Matters and the reports represent the views of Market Matters. The MarketMatters Report is based on technical analysis of companies, commodities and the market in general. Technical analysis focuses on interpreting charts and other data to determine what the market sentiment about a particular financial product is, or will be. Unlike fundamental analysis, it does not involve a detailed review of the company’s financial position.
The Reports contain general, as opposed to personal, advice. That means they are prepared for multiple distributions without consideration of your investment objectives, financial situation and needs (‘Personal Circumstances’). Accordingly, any advice given is not a recommendation that a particular course of action is suitable for you and the advice is therefore not to be acted on as investment advice. You must assess whether or not any advice is appropriate for your Personal Circumstances before making any investment decisions. You can either make this assessment yourself, or if you require a personal recommendation, you can seek the assistance of a financial advisor. Market Matters or its author(s) accepts no responsibility for any losses or damages resulting from decisions made from or because of information within this publication. Investing and trading in financial products are always risky, so you should do your own research before buying or selling a financial product.
The Reports are published by Market Matters in good faith based on the facts known to it at the time of their preparation and do not purport to contain all relevant information with respect to the financial products to which they relate. Although the Reports are based on information obtained from sources believed to be reliable, Market Matters does not make any representation or warranty that they are accurate, complete or up to date and Market Matters accepts no obligation to correct or update the information or opinions in the Reports.
If you rely on a Report, you do so at your own risk. Any projections are estimates only and may not be realised in the future. Except to the extent that liability under any law cannot be excluded, Market Matters disclaims liability for all loss or damage arising as a result of any opinion, advice, recommendation, representation or information expressly or impliedly published in or in relation to this report notwithstanding any error or omission including negligence.
To unsubscribe. Click Here