Subscribers questions (EVN, SSM, GMG, NSR, AMC, SKI, UBER US, TSLA US, CBA)

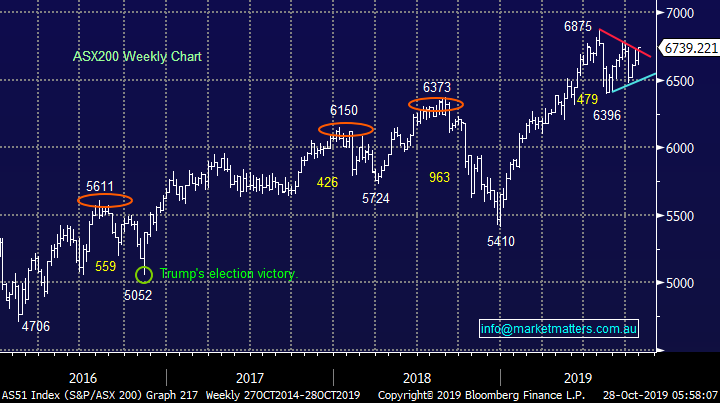
The ASX200 is threatening to breakout to the upside this week following a strong performance on Friday from both local and overseas markets. Our “Gut Feel” remains short-term bullish and we can see a squeeze to fresh all-time highs for many western indices – potentially an unpopular move because fund managers have been fairly aggressively moving monies from equities to bonds hence a strong stock market leads to underperformance from these cautious investors.
Again over the weekend we had no fresh market sensitive news just the continuation of a couple of recent stories, the important point being the path of least resistance clearly appears to be up i.e. lack of any bad news is being embraced by stocks:
1 – The housing markets remains strong with preliminary the clearance rate coming in at 75%, while housing remains strong the Australian economy can avoid that distant memory called a recession.
2 – the US and China appear to be slowly heading towards a trade agreement, albeit a stepping stone that we believe will cause further issues in the medium term.
3 – We are approaching the half way mark for US reporting season with the average beat for earnings just shy of 4%, in other words a solid US reporting season is dragging stocks kicking and screaming towards fresh all-time highs.
No change, MM remains comfortable being relatively defensive at this point in time but we have skewed portfolios towards the value stocks, as opposed to growth.
On Saturday morning the SPI futures were pointing to the ASX200 opening up over 20-points, remember fresh all-time highs for the local market is now only 2% away.
Thanks for the questions as always, we particularly appreciate the ones looking at a few positions we’re holding that are not yet going our way, as we regularly say – “look after the losers and the winners will look after themselves!”.
ASX200 Index Chart
As we touched on in the MM Weekend Report the US S&P500 Value Index made fresh all-time highs on Friday, we regard this as a bullish short-term indicator for both US stocks and specifically the Value Sector itself. Locally we have seen significant stock / sector rotation with a net upside bias for the major indices, this index breaking to new all-time highs is a great sign that our current view and portfolio positioning towards Value has merit.
MM prefers value stocks to growth at this stage of the cycle.
E.g. MM would rather hold resources than IT moving into Christmas but note market sentiment is moving fast, our current sector preference that historically often would have been a 6-month event could easily be over before Christmas in today’s market.
US S&P500 Value Index Chart

A quick look at the “Fear Gauge” below shows markets are rapidly returning to a relaxed stance although the Put / Call Ratio tells us there’s still plenty of protection in place for a short-term downside movesfor stocks, we draw a couple of quick conclusions from this information:
1 – For the next few weeks stocks look positioned to squeeze higher sending the VIX back down to its more historically dangerous 10% area.
2 – Any short-term leg lower in equities is likely to be short-lived as buyers appear positioned to buy dips.
MM believes markets are again slowly but surely becoming complacent.
US Fear Index / Volatility (VIX) Index Chart

Question 1
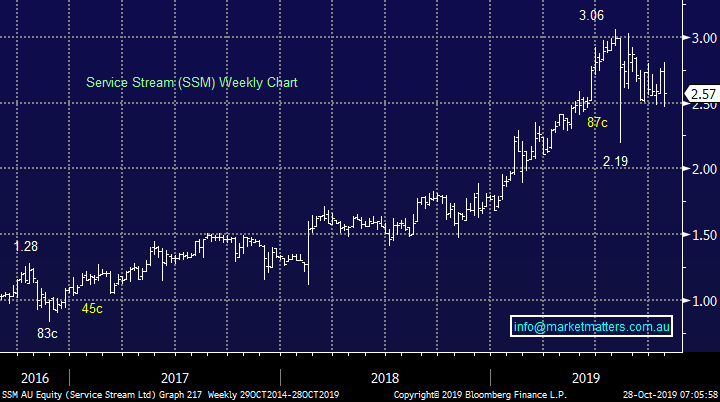
“Service Stream (SSM), James what is happening with the stock, looks bad on the trends." - Daniel C.
Morning Daniel,
Service Stream (SSM) has given us an uncomfortable first few days as shareholders due to the MD selling 49% of his shares, never a good sign but not always a bad one – the market and ourselves prefer businesses where the board has significant “skin in the game”. We liked the latest set of numbers SSM delivered to the market and its almost 4% fully franked dividend is not to be sniffed at in today’s low rate environment.
We’re giving the position a little time for the dust to settle but we will not get married to it if losses start to build – we have no interest in averaging at this point.
MM is cautiously optimistic on SSM at present.
Service Stream (SSM) Chart
Question 2
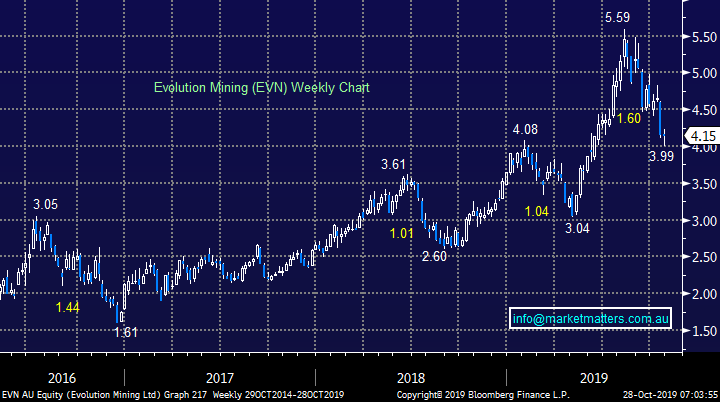
“Hi Harry / James, Just reflecting on the below question I had for you in September soon after the MM - EVN buy recommendation. An update on your view will be appreciated.” - Kind regards Errol K.
Hi Errol,
Evolution Mining (EVN) is undoubtedly under pressure after the last 2-weeks declines, we clearly picked the low too early. However the gold price and gold stock ETF’s still look good so we’re not panicking yet but like SSM this stocks is on a short leash from here, especially as we believe the $A and bond yields may be at / close to a significant bottoming stage, both of which would become a headwind for Australian gold stocks.
MM is cautiously optimistic on EVN just here.
Evolution Mining (EVN) Chart
Question 3
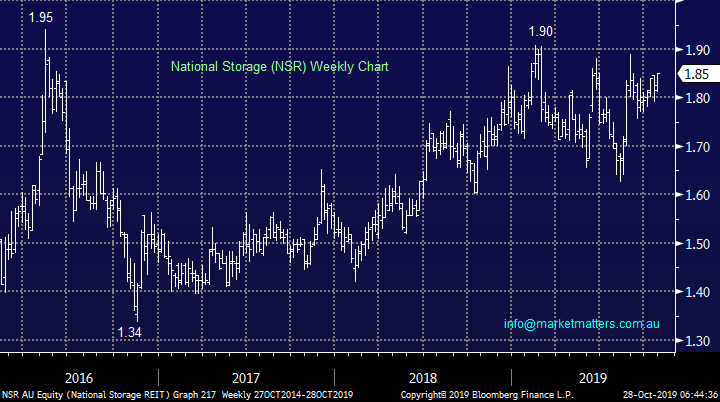
“Hi James,. I would like your view on GMG and NSR as I am thinking of adding them to my SMA as a defensive play. Would AMC be a better option as suggested by Shaw?” - David M.
Hi David,
At MM we can only offer General Advice hence I’ve simply offered my quick take on each stock for your consideration:
1 – Goodman Group (GMG) is a quality property company that is set to enjoy interest rates lower for longer, we are net bullish the stock targeting fresh all-time highs but would run stops on longs below $13.90 – good risk / reward.
Goodman Group (GMG) Chart

2 - National Storage (NSR) is a real estate investment trust which is currently yielding 5.2% unfranked. While technically we are bullish targeting a test of $1.95-$2 the risk reward at current levels is average at best, however the yield is clearly attractive.
National Storage (NSR) Chart
Packaging business Amcor (AMC) is clearly not in the same sector as GMG / NSR but it is becoming very interesting into current weakness – the $12.50-$13 area is optimum as a technical entry area, another ~8% lower. The current 5% unfranked yield is obviously becoming attractive to the yield hungry investor.
Amcor Plc-CDI Chart

Question 4
“Your view on Bitcoin as an investment and can this be done on the ASX or other share markets. I.e. ETF ?” – Mike C.
Hi Mike,
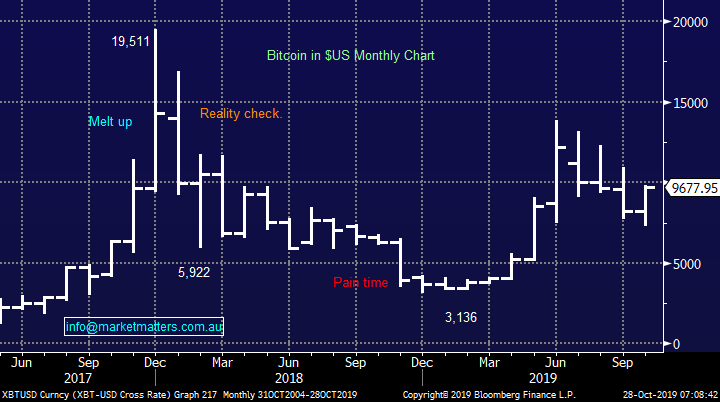
At MM we don’t regard Bitcoin as an investment, its more of a casino, highly speculative asset (kind of) in our opinion and as such we would only look at trading it with when attractive risk / reward opportunities present themselves – the chart below illustrates the volatility in Bitcoin, it’s a beast!
However interestingly technically we are bullish Bitcoin looking for an eventual rally back towards 15,000 but again I stress it’s not for us.
There are a number of platform providers but as I’ve never considered joining this game unfortunately I cannot offer any personal experience on the best ways to implement a view . However Adam who has been with MM for many years has been known to venture into this arena and his preferred vehicle is: https://www.independentreserve.com/market/btc
Bitcoin ($US) Chart
Question 5
“Dear James, Since SKI was purchased for the Income fund, the position has gradually fallen. Is SKI still a buy, or should one's losses be cut now ?” - best wishes John K.
Morning John,
Utility investor Spark Infrastructure (SKI) was purchased for the Income Portfolio primarily for its greater than 7% unfranked dividend at $2.16, now the stock is trading around $2.04. We originally paid up above our $2 intended target given the movement in bond yields at the time – they had rallied and we took to view of fading them by buying SKI & TCL for the income portfolio – we were right on yields however SKI has not traded to plan (yet). If we see ongoing weakness towards $1.90 we will consider averaging this position.
MM remains comfortable holding SKI in our Income Portfolio.
Spark Infrastructure (SKI) Chart

Question 6
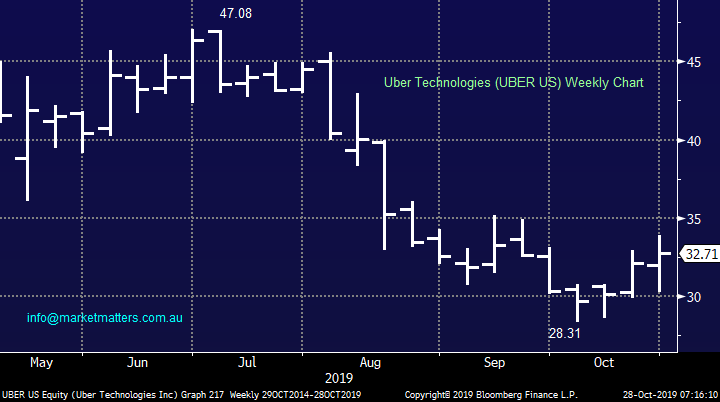
“Hi there, quick question - do you have a view on Uber. There is increasing view that the entire business is fundamentally overvalued and unsustainable. If one wanted to short uber, is that possible from Australia?” - Regards, James D.
Hi James,
Uber is not a story / stock that I like, its valued at $US55bn yet it lost $US1bn in Q1 of 2019, on revenue of $US3.1bn but shorting it is a very different proposition. Consider Tesla who is also burning cash at a rate of knots, there have been many high profile shorter’s of Elon Musk’s business and most have taken a bath. It is easy / straight forward to short Australian stocks however I haven’t looked at shorting overseas stocks.
MM prefers to watch Uber with interest but not short.
Uber Technologies (UBER US) Chart
Tesla (TSLA US) Chart

Question 7
“Hi, Given your report on the upcoming Perls X11 offer and commentary regarding existing hybrids of similar timeframes for first call, what is your expectation of the market price on listing. I note MQG hybrid is trading at around $107, ANZ $105 and CBAPH $104.50. Thanks Paul B.
Hi Paul,
The best listed comparable at the moment is the NABPF which has 6.9 years to first call date. This security is now trading on a yield to first call of 2.99% implying that the CBA will likely list around its $100 face value, maybe $101ish given it’s a CBA issue that was well overbid. The nearest CBA note is the CBAPG which has 5.5 years to first call and is trading on a margin of 2.89%, again implying the new CBA hybrid which will trade under code CBAPI and is expected to list on the 19th November 2019 will trade near enough to par unless something meaningfully changes in risk premium between now and then.
MM is neutral the new CBA issue and we did not add it to our income portfolio
National Australia Bank Capital Note (NABPF) Chart

Question 8
“Hi James, Harry and Co, Perhaps for the Monday Qs. Given your recent view regarding interest rates likely at lows, central bank stimulus/QE coming, what are your plans for current exposures to gold, neg facing ETFs BBUS/BBOZ, and bonds? I realise you have recently purchased XARO. Could you comment on bonds more generally for the benefit of members with defensive bond exposure. Thanks again for the ongoing stimulating info.” - Regards, Radley
Hi Radley,,
Firstly thanks as always for the thumbs up!
A great and obviously comprehensive question that I have segmented into a few parts:
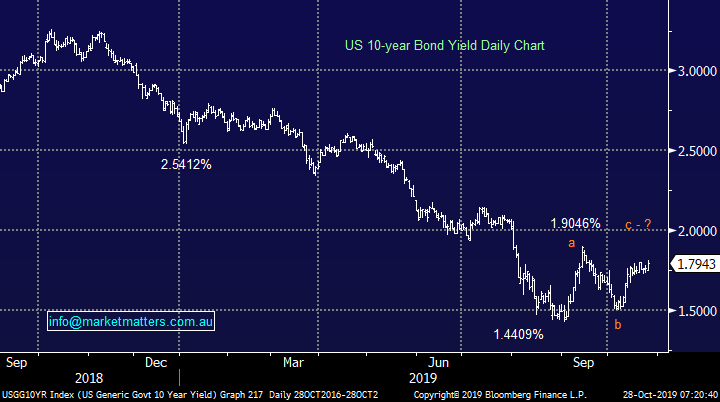
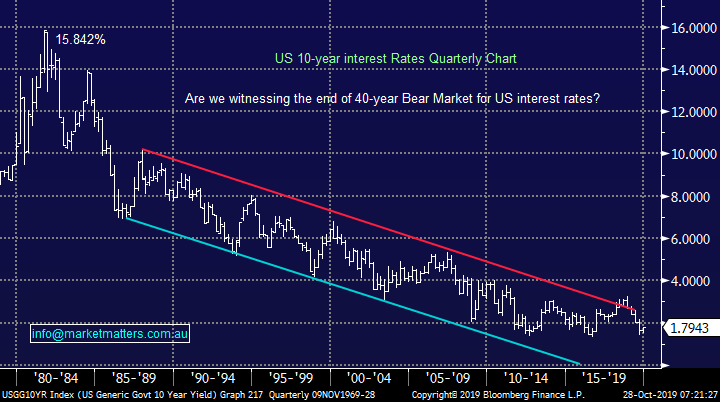
1 - With regard to our “gold, neg facing ETFs, and bonds positions” like all positions we are watching them very closely, if we see inflation raise its head after fiscal stimulus leading to subsequent rate hikes, something that’s miles away at present, its likely to be supportive of our gold and negative facing ETF’s with the main pressure likely to be felt in our Income Portfolio but I stress that’s not our preferred scenario. At this stage MM believes bond yield are close to / at the nadir of their multi-decade bear market but they can stay easily around here for another decade.
We like interest rates being “lower for longer” until we see inflation raise its head - the second chart below shows how US 10-year bonds have been oscillating around 2% for a decade already.
However its stocks / sectors that we believe are positioned for rates to keep falling where MM can see underperformance moving forward.
2 – Bonds / bond yields look poised to bounced between 1 .25% & 2% for the next 3-months which is likely to see sectors come in / out of favour a few times as the yield elastic band becomes stretched in both directions i.e. we expect bonds to trade in a relatively tight range into 2020 enabling investors to tweak portfolios accordingly by buying bonds at 2% and selling bonds ~1.25%.
Specifically in terms of XARO, this is an active bond manager that buys bonds they believe are cheap and shorts bonds they believe are expensive. It’s a relative value strategy with very minimal duration risk – we have added this type of bond exposure in our portfolio for asset allocation reasons / we need defensive positions in the income portfolio, however we would prefer to back a good active manager with a good track record to deliver performance than rely on bonds continuing to rally in an outright sense.
US 10-year Bond Yield Chart
US 10-year Bond Yield Chart
Question 9
“Hi MM as a new subscriber I'm still finding my feet but love the ideas you are putting up. I do my own research and pick and choose from the suggestions you put up. No one is 100% accurate. Some ideas make sense like buying resources at current levels but others not so appealing. Time will tell if you are correct. I live in regional Australia and am retired. Its bl
y tough being a country person dealing with my life savings when interest rates are so low. Forced to take a risk on the stock market. I disagree with your view on the big 4 banks. The game has changed. The compliance costs are huge and NIMs impacted on lower interest loans. The dividends will surely fall. If the USD falls won't the Aust resources sector also have profits challenged? Can you explain how buying US shares direct compares to buying an ASX listed US share ETF? the costs and practicalities of dealing with the currency and admin required to buy direct. At what level does it become economic to go direct and how can an Aust investor do it the easy way?” - Regards Marvin C.
Hi Marvin,
I really feel for all Australians living in the country at the moment, I’m confident that Sydneysiders like myself have very little idea exactly how tough the drought actually is, our thoughts are with you here Marvin.
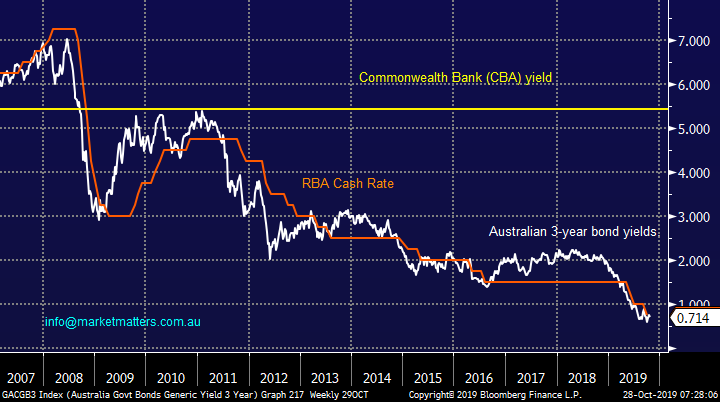
1 – On the banks sure there’s always the possibility rates will fall but with CBA yielding 5.3% fully franked compared to most term deposits paying sub 1.5% unfranked there feels to me a decent cushion in the price, as you say time will tell. For what it’s worth, rating agencies actually just raised their outlook on the Australian banks given the orderly decline and rebound in Australian property prices. In terms of compliance costs, the impost here is biggest on the regionals.
2 – If the $US falls it indeed has a negative effect on the resources but conversely the $ usually rallies because commodity prices are increasing which is likely to more than offset the FX headwind.
3 – There are a number of different US equities ETF’s so you are likely to be able to pick one to suit your views e.g. currency hedged / unhedged. Buying individual shares is now simple and can be executed on most major platforms but the obvious risk is around stock selection, conversely this also offers the best returns – the old risk / reward. Through Shaw & Partners, we can trade in direct international equities around the world – drop me a line if you’d like to talk further about it.
3 Major Australian interest rates Chart
Question 10
“Hi M&M team, can you give your opinion on CBA and if you still think it will reach its $85 target? And also is NST gold stock worth buying into? Thank you love your work.” – Tony B.
Hi Tony,
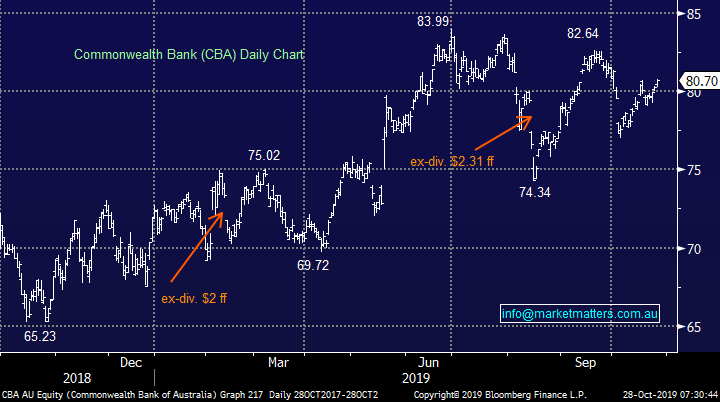
CBA still looks good to us, its 5.3% fully franked yield is clearly a nice tailwind into 2020 with the next dividend ~$2 due in February. Another 5% upside to $85 feels very realistic at this point in time.
MM remains bullish and long CBA.
Commonwealth Bank (CBA) Chart
Overnight Market Matters Wrap
- The US equities markets closed higher last Friday as investors appetite for risk slowly eases back on the tip of their tongues with the tech. heavy Nasdaq 100 outperforming its peers.
- The rally last Friday was stemmed from US-China trade negotiations looking to head in the right direction after US officials made a statement that both nations are edging closer to an agreement on phase one of the trade accord along with expectations of the Fed Reserve to cut its key interest rate by 0.25% this week.
- Metals on the LME were mostly weaker with both nickel and copper trading lower, while iron ore traded higher along with crude oil which leads BHP to outperform the broader market after ending its US session up an equivalent of 0.86% from Australia’s previous close.
- The December SPI Futures is indicating the ASX 200 to open 28 points higher towards the 6765 level this morning.
Have a great day!
James & the Market Matters Team
Disclosure
Market Matters may hold stocks mentioned in this report. Subscribers can view a full list of holdings on the website by clicking here. Positions are updated each Friday, or after the session when positions are traded.
Disclaimer
All figures contained from sources believed to be accurate. All prices stated are based on the last close price at the time of writing unless otherwise noted. Market Matters does not make any representation of warranty as to the accuracy of the figures or prices and disclaims any liability resulting from any inaccuracy.
Reports and other documents published on this website and email (‘Reports’) are authored by Market Matters and the reports represent the views of Market Matters. The Market Matters Report is based on technical analysis of companies, commodities and the market in general. Technical analysis focuses on interpreting charts and other data to determine what the market sentiment about a particular financial product is, or will be. Unlike fundamental analysis, it does not involve a detailed review of the company’s financial position.
The Reports contain general, as opposed to personal, advice. That means they are prepared for multiple distributions without consideration of your investment objectives, financial situation and needs (‘Personal Circumstances’). Accordingly, any advice given is not a recommendation that a particular course of action is suitable for you and the advice is therefore not to be acted on as investment advice. You must assess whether or not any advice is appropriate for your Personal Circumstances before making any investment decisions. You can either make this assessment yourself, or if you require a personal recommendation, you can seek the assistance of a financial advisor. Market Matters or its author(s) accepts no responsibility for any losses or damages resulting from decisions made from or because of information within this publication. Investing and trading in financial products are always risky, so you should do your own research before buying or selling a financial product.
The Reports are published by Market Matters in good faith based on the facts known to it at the time of their preparation and do not purport to contain all relevant information with respect to the financial products to which they relate. Although the Reports are based on information obtained from sources believed to be reliable, Market Matters does not make any representation or warranty that they are accurate, complete or up to date and Market Matters accepts no obligation to correct or update the information or opinions in the Reports. Market Matters may publish content sourced from external content providers.
If you rely on a Report, you do so at your own risk. Past performance is not an indication of future performance. Any projections are estimates only and may not be realised in the future. Except to the extent that liability under any law cannot be excluded, Market Matters disclaims liability for all loss or damage arising as a result of any opinion, advice, recommendation, representation or information expressly or impliedly published in or in relation to this report notwithstanding any error or omission including negligence.