Subscribers questions (ORE, GDXJ, PAC, HYD, PDN)
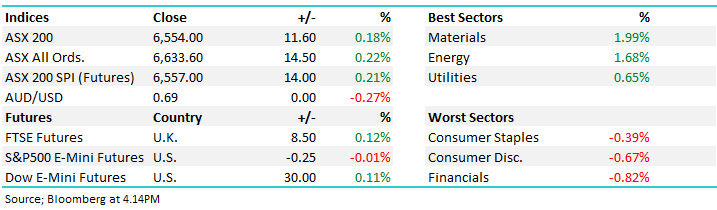
We have started to witness some divergence between US equities and our own with the later the clear winner if late e.g. the ASX200 is poised to open down ~30-points today even after the Dow rallied 243-points to fresh all-time highs on Friday night. Not surprisingly the sectors setting US markets alight are the Industrials and Consumer Discretionary stocks whereas dragging the chain are the defensive Healthcare, Utilities and Real Estate sectors, clearly US investors remain bullish. Fed Chair Jerome Powell’s “almost promise” of 2 rate cuts in the US between now and Christmas is unlocking US investors belts although many are questioning what he’s seeing in their current data to be so concerned about the health of the US economy.
Over the weekend the news was light on the ground both locally and overseas although property auction results remain strong. Sydney’s auction clearance rate was sitting at 74% last night, although volumes remained low due to school holidays, it feels like buyers are scarred to miss out on the recent dip in prices and are paying up quickly. While Australian property prices regain their mojo a number of stocks / sectors will breathe a collective sigh of relief in the local market, a few more months of these numbers and the bears will go back into hibernation probably giving a lift to consumer confidence in the process.
At MM we remain in “sell mode” for our Growth Portfolio but not in an aggressive manner with our cash level already elevated to 25%. Plus, we continue to consider a few stock “switches” that should make the portfolio more defensive in nature.
We reiterate no sell signals have been generated but our “Gut Feel” remains the next 200-point swing is more likely down than up i.e. sub 6600. However investors should not forget the relative value supporting equities into weakness with term deposits paying below 2% compared to the ASX200 yielding over double as is ~75% franked to boot.
Thanks as always for the questions which were a touch down on the usual volume probably for a tri-factor of reasons - school holidays, a relatively quiet market and a cricket World Cup.
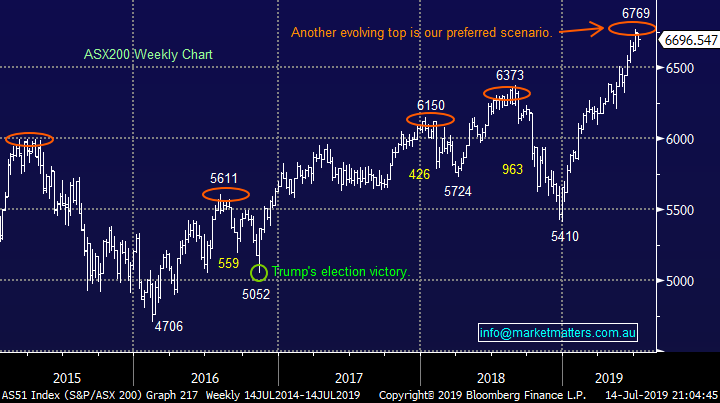
ASX200 Index Chart
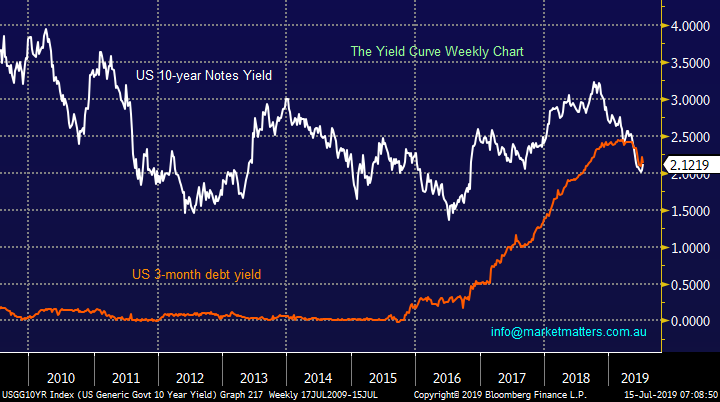
The US yield curve remains inverted i.e. long-term debt has a lower yield when compared with short-term debt. This is only the 3rd time in 20-years that we have seen US 10-year notes yielding less than 3-month debt. Historically this scenario has forecast a recession but at this stage US stocks are clearly backing the Fed and its QE arsenal to avoid this meaningful downturn in their economy.
It feels like a classic case of investors saying this time will be different as they remain confident that central banks will continue to win the battle, as they indeed have since the GFC. This will remain a market characteristic we focus on closely over the months to come because we feel there will be an “uncle point” where the differential in yields becomes simply too large and investors will become nervous and press the sell button, at this stage it’s not a significant inversion.
NB An inverted yield curve is the rarest of the three main curve types and is considered to be a predictor of economic recession.
US 10-year and 3-month yields Chart
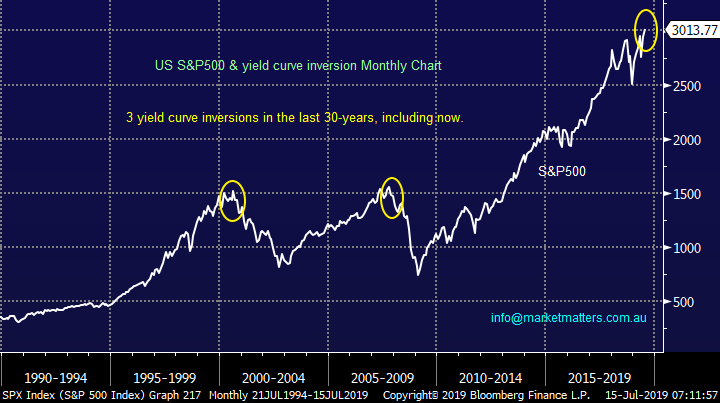
As we said last week the relationship to equity markets is pronounced and painful, stock markets do not enjoy a recession. I have shown below the previous 2 times when the US yield curve inverted in the same meaningful manner – stocks were simply hammered. Our medium-term target for the US S&P500 of 3000-3050 area has been achieved leaving us cautious, especially when we consider the yield curve.
MM remains neutral / cautious on US stocks.
US S&P500 & the yield curve Chart
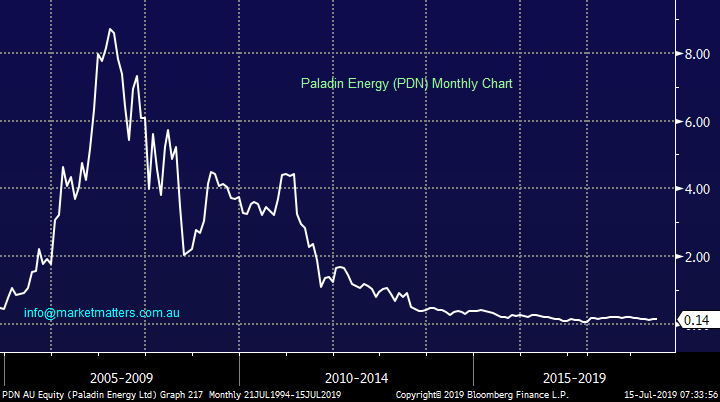
It appears that Donald Trump has given our Uranium Industry a leg up, or more to the point he hasn’t slapped it in the face by implementing a “buy America” policy. Australia enjoys ~$400m of Uranium exports from 3 companies, BHP, RIO and US firm General Atomics. The President looks set to go against the Commerce Department for now, to put things in perspective this affects ~60% of our uranium exports!
The reason this story caught my eye was the numerous questions we have been asked around junior player in the space Paladin Energy (PDN) as this explorer garnered much attention when we recently saw Paradice Investments pop up on the share register in a meaningful manner.
With a market cap of $245m and a share price currently bouncing around between 10c and 22c this is undoubtedly a play at the very speculative end of town. At this stage this is still not one for us but considering PDN has fallen over 30% from its November high this appears an ideal time for the very aggressive amongst the MM community.
PDN looks an aggressive buy with stops below 10c.
Paladin energy (PDN) Chart
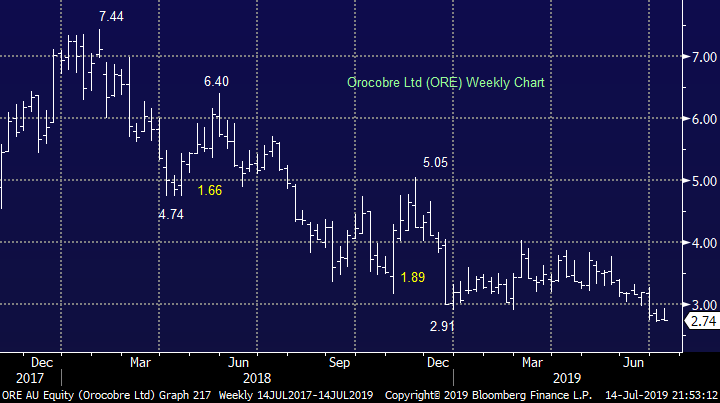
Importantly to MM the likely Uranium decision is a good reflection on the future for rare earth metals and minerals such as lithium. The lithium part of the equation is important to MM as we are currently long sector heavyweight ORE and its certainly been a drag on our portfolio to-date. However we have been considering averaging this position for a few weeks and this may be the catalyst for a few buyers to emerge, we will be watching carefully.
MM is seriously considering averaging our ORE holding.
Orocobre (ORE) Chart
Question 1
“Hi to you all, I have been closely watching the S 'n P 500 as have you folk Was going to ask today if you thought time to open a position..and now you have. The previous time you opened this trade was using BBUS a geared entry. I had done the same during the December downturn I am curious as to your latest ETF choice I am not asking for advice....just want to know the point of difference and why you made the call many thanks and have a great day” – Malcolm S.
Morning Malcolm,
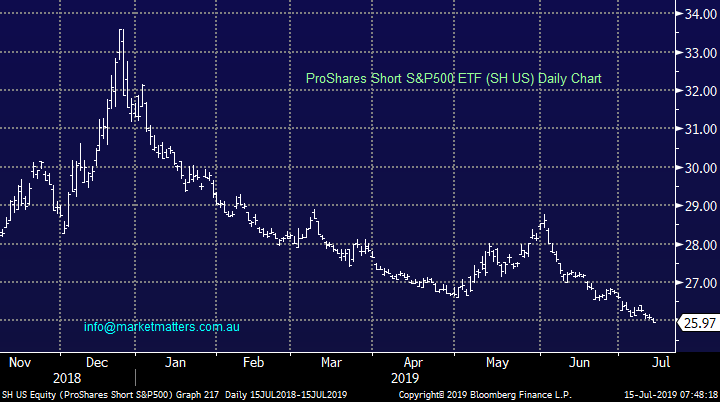
We chose the ProShares short ETF (US SH) over the previously used BBUS ETF for 2 simple reasons:
1 – The SH trades significantly more volume courtesy of it being domiciled in the US like the S&P500 e.g. on Friday night it traded ~2.6m units. This depth helps lower the spread costs between both buying & selling.
2 – The SH is not a leveraged product which suits our current stance of looking to “build” a position into strength as we await a clear sell signal on US stocks.
3 – The new Global ETF portfolio is not constrained by simply investing in ASX listed products however, for those only using ASX products, the BBUS will certainly do the job, however remember, it is leveraged.
MM sees decent risk / reward on the downside for US equities.
ProShares short S&P500 ETF (SH US) Chart
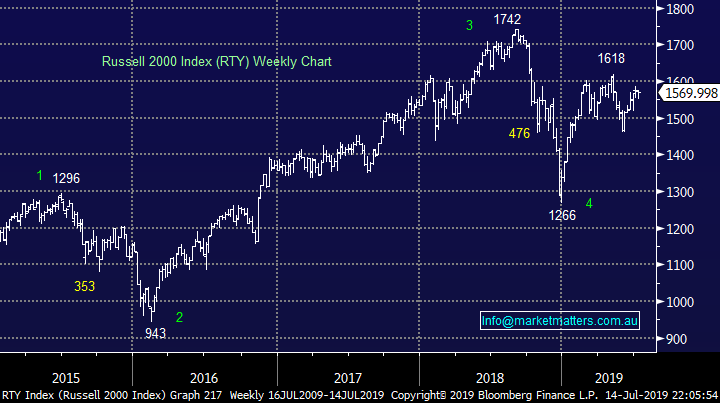
The S&P500 is in a classic sell position / area whereas the small cap Russell 2000 is more 50-50 i.e. did it top back in 2018 or is it poised to surprise many and make another push higher by ~10%. Hence our caution to go “all in” short US stocks at this stage.
Russell 2000 Index Chart
Question 2
“Hi Team, Question : If Marcus Padley and others are correct which 10 stocks would you put on a must buy if they drop list? I just read-- Several analysts have told PM a major stock market correction is imminent. "Something's clearly wrong," veteran market watcher Marcus Padley said. Plus, Australia is at risk of an imminent market correction that would leave thousands of older Australians approaching retirement out of pocket, analysts warn” – Regards Richard
Hi Richard,
While we are tweaking our Growth Portfolio to a far more conservative / defensive stance given the markets position, big calls like the ones above are often designed to attract readers / clicks rather than anything else. The obvious issue with calling an imminent market correction is picking the actual straw that breaks the camel’s back, a very difficult task and as we often say, picking market tops is trickier than picking bottoms.
However moving onto actually answering you question, the below 4 points should shine some light on our thoughts:
1 - A defensive portfolio construction is as much about what you avoid as what you buy – at MM we will be avoiding high beta and growth stocks with the best way to identify these potential “culprits” simply by revisiting stocks that were smacked the hardest in late 2018.
2 – Cash can be king for short periods of time but not in the long run, that prize belongs to equities hence while we are comfortable currently holding 25% cash today but we are always looking for opportunities to deploy this $$.
3 – If we become seriously concerned to the short-term health of stocks we may simply buy a defensive negative facing ETF e.g. BEAR as opposed to mass selling of stocks that still provide a steady yield i.e. hedging our portfolio.
4 – Stocks we like over the next 12-months are ones which produce a sustainable recession proof yield like Tabcorp (TAH) and Telstra (TLS) but the issue is many people have the same opinion so valuations are rich in many of these names. Also we like the resources, especially iron ore names into a correction, and we are looking to hold 1 or 2 gold names moving forward although we feel a US facing ETF like the GDX is likely to outperform if our call for a stronger $A proves correct.
In essence as opposed to saying buy these 10 names we prefer a mixture of stocks, cash for flexibility and negative facing ETF’s to insulate our portfolio against short term capital losses.
To view the current MM Growth Portfolio which reflects the shares we like at this point in time: CLICK HERE
ASX200 Chart
Question 3
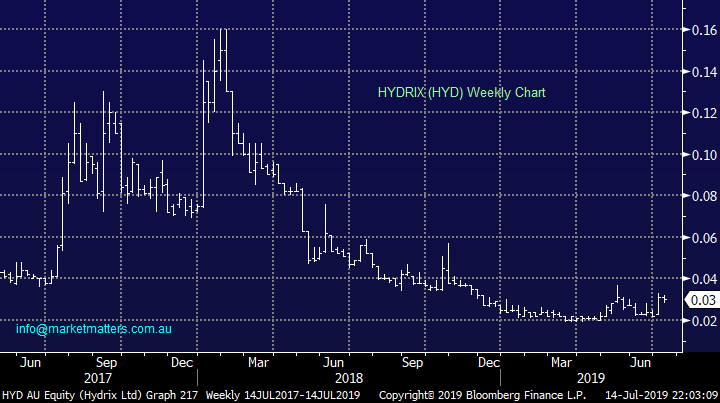
“Hi, do you have any potential views on HYDRIX? I bought them 3 years ago for 8 cents as I was told they were going to take off. They are now about 3 cents???” – Geoff L.
Hi Geoff,
A micro-cap medical technical company valued at $9m with its shares clearly hit very hard over the past couple of years. On the positive side, the company has seen its revenue grow reasonably well in the last 5 quarters and in Q4 of 19 they made their first quarterly profit – so it could actually be in a turnaround phase – but still early days.
Unfortunately we’ve all lost money on tips, its part of the learning curve with regard to investment, and this feels like a classic case looking at the shares decline. Technically I could buy HYD with stops below 2.3c but it feels like a casino and we all know the house wins there!
MM has no interest in HDY.
HYDRIX (HDY) Chart
Question 4
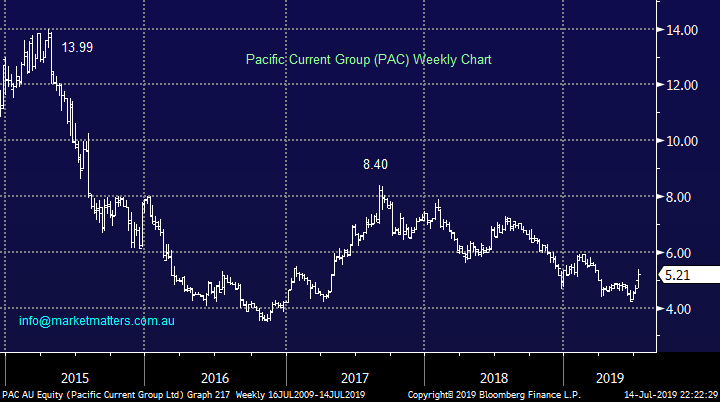
“Great note. COH does looks expensive. Here is an idea below ... Pacific Current ... looks very cheap with a growing book. Be interested if you guys have a view on it at some point on it.” – Rodney F.
Hi Rodney,
Pacific Current Group (PAC) is a small cap asset manager valued below $250m. One of the biggest issues is many of the larger supposed quality names in the space are also struggling which makes it hard to get too excited with PAC – although I do think there is a lot more interest now being shown towards smaller boutique investment managers.
I acknowledge it looks ok value trading on an estimated P/E for 2019 of 11x but the market currently doesn’t like the business as its been falling since 2017, in a bull market, remember “don’t fight the tape” without a good reason. This is a business that we would be considering if we felt the market was near a major low but not when we are seeing diminishing risk / reward opportunities in equities.
We would be looking for a catalyst to prick up our buying ears like decent insider / director buying but at the moment its simply not exciting.
MM is not keen on PAC at this point in time.
Pacific Current Group (PAC) Chart
Question 5
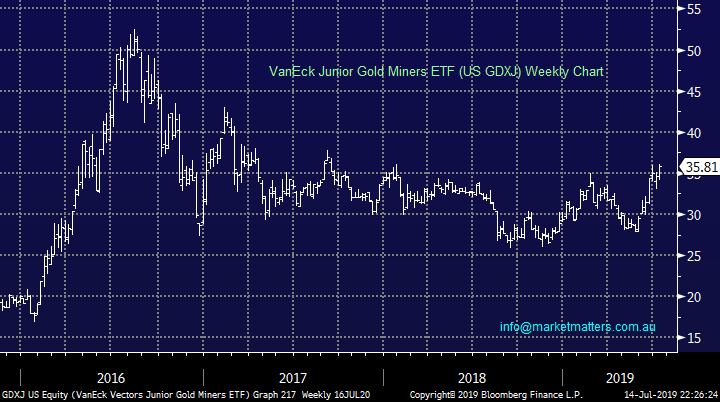
“Hi James, I wonder if you could make a comment about the smaller gold producers. There is plenty of coverage on the main players but there must be smaller producers who will give a return to shareholders.” - Thanks Greg C.
Hi Greg,
I acknowledge we at MM are indeed guilty of focusing on the larger producers, often because they trade greater volumes enabling us to buy and sell easily with clearly defined risk / reward plus importantly they usually have lower costs of production.
Rather than evaluating a large number of junior gold miners where hand grenades often lurk we would prefer to play this angle with a US based ETF, especially due to our bullish $A view.
We likes the Junior Gold Miners ETF (US GDXJ).
VenEck Junior Gold Miners ETF (GDXJ) Chart
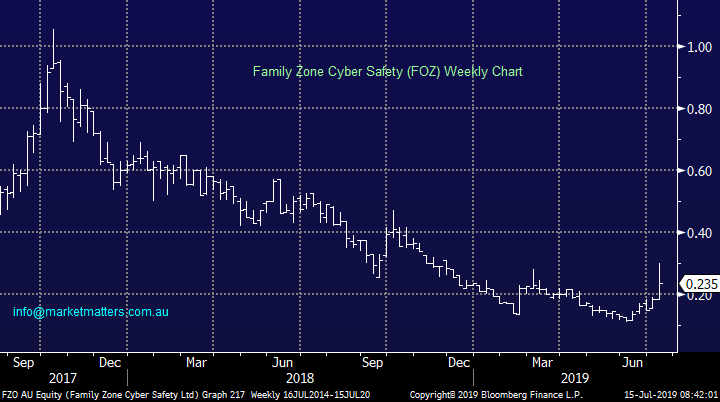
Question 6
“Hi Team, I enjoy reading your emails and ideas. You look to cover and take an interest in growth stocks. Might be worth putting FZO on your watch list…growing sector, and good US growth has begun.” - Kind regards, Mark B.
Morning Mark,
Everything does read extremely well in the sector of parental cyber security but unfortunately FZO has failed to ignite market interest over the last 18-months. However the company enjoyed a well-received market update for the June quarter with the 2 highlights being 173% quarter on quarter growth of $$ of contracts sold and paying subscribers passing 130,000.
This is undoubtedly a growth industry and the believers in FZO can play it technically at todays prices, especially after its recent encouraging market update : buy with stops under 15c, but note this is a very aggressive play.
MM is neutral / bullish FZO.
Family Zone Cyber Safety (FOZ) Chart
Overnight Market Matters Wrap
· The US equity markets pushed through and continued to closed at record highs last Friday as investors prepare themselves for an anticipated rate cut as well as US earnings kick off tonight starting off with Citigroup.
· The RBA will be watching the labour market data this week. If inflation remains subdued, we could see another rate cut in Australia. The US-China trade war will be front of mind when Chinese industrial production and GDP are released at midday today.
· Nickel was the standout on the LME, rising nearly 3%, while oil traded a touch higher. Gold is $US1417.7/oz while iron ore is slightly down.
· The September SPI Futures is indicating the ASX 200 to 22 points lower, testing the 6675 level this morning.
Have a great day!
James & the Market Matters Team
Disclosure
Market Matters may hold stocks mentioned in this report. Subscribers can view a full list of holdings on the website by clicking here. Positions are updated each Friday, or after the session when positions are traded.
Disclaimer
All figures contained from sources believed to be accurate. Market Matters does not make any representation of warranty as to the accuracy of the figures and disclaims any liability resulting from any inaccuracy. Prices as at 15/07/2019
Reports and other documents published on this website and email (‘Reports’) are authored by Market Matters and the reports represent the views of Market Matters. The MarketMatters Report is based on technical analysis of companies, commodities and the market in general. Technical analysis focuses on interpreting charts and other data to determine what the market sentiment about a particular financial product is, or will be. Unlike fundamental analysis, it does not involve a detailed review of the company’s financial position.
The Reports contain general, as opposed to personal, advice. That means they are prepared for multiple distributions without consideration of your investment objectives, financial situation and needs (‘Personal Circumstances’). Accordingly, any advice given is not a recommendation that a particular course of action is suitable for you and the advice is therefore not to be acted on as investment advice. You must assess whether or not any advice is appropriate for your Personal Circumstances before making any investment decisions. You can either make this assessment yourself, or if you require a personal recommendation, you can seek the assistance of a financial advisor. Market Matters or its author(s) accepts no responsibility for any losses or damages resulting from decisions made from or because of information within this publication. Investing and trading in financial products are always risky, so you should do your own research before buying or selling a financial product.
The Reports are published by Market Matters in good faith based on the facts known to it at the time of their preparation and do not purport to contain all relevant information with respect to the financial products to which they relate. Although the Reports are based on information obtained from sources believed to be reliable, Market Matters does not make any representation or warranty that they are accurate, complete or up to date and Market Matters accepts no obligation to correct or update the information or opinions in the Reports. Market Matters may publish content sourced from external content providers.
If you rely on a Report, you do so at your own risk. Past performance is not an indication of future performance. Any projections are estimates only and may not be realised in the future. Except to the extent that liability under any law cannot be excluded, Market Matters disclaims liability for all loss or damage arising as a result of any opinion, advice, recommendation, representation or information expressly or impliedly published in or in relation to this report notwithstanding any error or omission including negligence.


