Subscribers questions (RIO, FMG, APX, RFF, CBA, BBOZ, CQE, WHC)

Well, we made it….just! More than 1100k’s through the South Australian Outback raising money for the Apex Foundation. It was a tougher ride than we thought – cold, plenty of spills, Harry has some sore ribs, a bung knee and took the title for first puncture only 30 minutes into the ride, but we’re both in one piece and better for the experience. What a huge, harsh country we live in and it was sensational to get out of the ‘Chifley Tower bubble’ and see what real Australia is. Some amazing characters - mates helping mates and all for a great cause. More coverage to come in time for those interested.

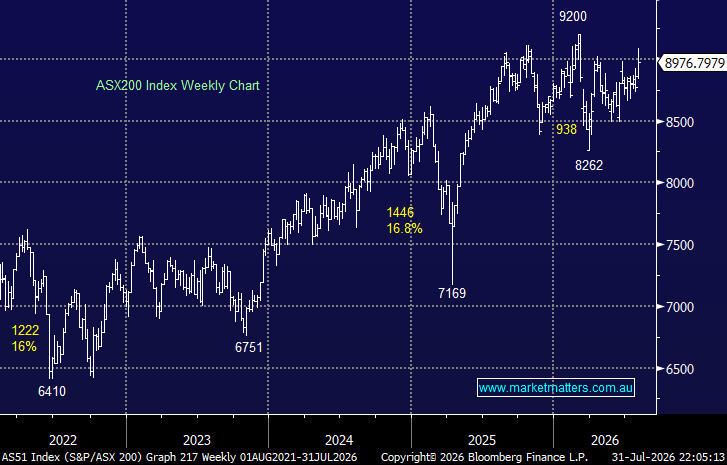
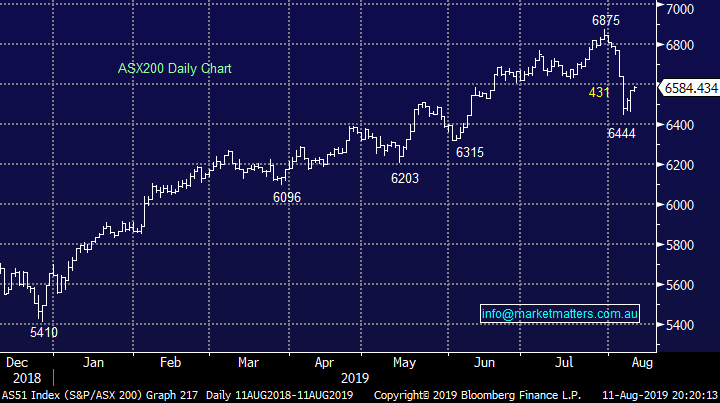
Back to the desk last night / this morning and stock markets have become increasingly volatile over recent sessions as the US-China Trade War heats up, a global recession is starting to feel inevitable, bond yields continue to collapse plus of course locally we are now in the middle of reporting season (no First Reactions this morning as I’m working from our Adelaide office – back online tomorrow). Last week the ASX200 fell 324-points / 4.8% at its worst with over 80% of the market still finishing in the red even after a decent bounce, it was a “push me pull me” sort of week as the sentiment changed intraday at times. As mentioned previously it’s only the interest rate side of the equation currently supporting stocks as reporting season has certainly been a negative influence to-date:
Market Matters reporting season calendar through August: Click here
Over the weekend the news was relatively quiet for a change with further positive results coming from property auctions as falling interest rates and relaxed lending conditions appear to have enticed some buyers back into the market.
The SPI Futures are calling our market down around 20-points this morning following tech based weakness on Wall Street where the NASDAQ fell over 1%, an ominous sign for our Software & Services Sector today. We are now in mild “sell mode” for our Growth Portfolio, after having bought into the recent iron ore stocks weakness as planned, our cash position feels slightly light considering our short-term view.
Sell signals have been generated by US indices and even after recent falls the downside risks remain a concern.
Thanks for the great volume and quality of questions, I strongly recommend subscribers read to the end, we don’t leave the boring or negative questions / comments until last!
PS Please excuse the brevity at times but the number of questions was high.
ASX200 Index Chart
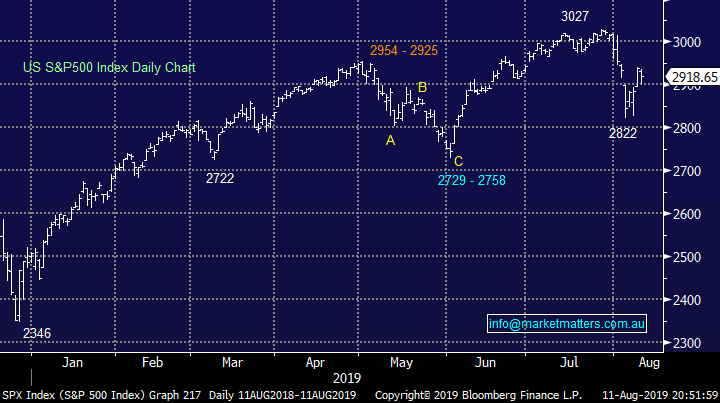
US stocks have generated the technical sell signal we had been anticipating for most of July, it’s no real surprise to MM as we feel from a fundamental perspective current valuations are too rich for stocks to ignore the escalating risks of a US-China Trade War & a potential global recession – both are potentially awful news for stocks. Tumbling bond yields / interest rates continue to support stocks but we feel they only can do so much when stocks aren’t cheap, MM believes we have entered a new short-term cycle for US stocks where bounces should be sold for the active trader.
MM is short-term bearish US stocks initially targeting a move by the S&P500 towards 2750, ~6% lower.
US S&P500 Index Chart
Last week we highlighted the failed attempt to break out to the upside by the $US even after the theoretically bullish rhetoric from the FED, a bearish signal to MM that proved correct as the Greenback had a poor week enabling the $A to recover over 2c from fresh decade lows.
The next few % for the $US still looks down, theoretically supportive of the $A.
One of our major calls for the next 12-months is a very contrarian one i.e. MM is bullish the $A, interestingly we believe one of the most crowded trades on the ASX is long $US earners, remember a crowded trade becomes a very dangerous place to be when it turns around.
The $US Index Chart

Question 1
“Question for the weekly report: Hi, I am a new subscriber and find the educational value of your reports fantastic. I have 2 questions: 1) The first is a question about positioning for a correction. Don't defensive stocks just depreciate less than market in a correction (for example Telstra in December) while counter cyclic strategies appreciate (for example gold and short equity positions). If this is fundamentally correct what other products or stocks appreciate during a correction? 2) Can you comment on your reasons for being long the $AUD? If you are predicting economic slowdown (or trade war) doesn't that usually negatively impact our resource sector and therefore currency?” – Guy P.
Morning Guy,
A great question (s) which obviously we will tackle in 2 halves, our thoughts on the $A has certainly garnered some attention, both previously and today.
Our flagship Growth Portfolio can be best described as stated on our website : “This is an ‘absolute return’ approach, will go to high levels of cash if warranted and can benefit from market downturns by investing in funds that inversely track the market.”.
Hence holding a portfolio that falls say 5% when the markets tumbles 20% is still not particularly exciting for MM, unlike how it would be for many. We are prepared to adopt a 50% cash position as we did in 2015 plus buy aggressive facing negative ETF’s as we did in Q4 of 2018, obviously if and when we become convinced the pullback is going to become more sinister than what we have witnessed to-date.
Hence how we position ourselves will depend on whether we believe the current choppy decline will evolve into a something closer to the three pullbacks around 1000-points post the GFC. However if we do become far more defensive we will keep our approach simple (KISS):
1 – High cash levels awaiting exciting opportunities which inevitably present themselves.
2 – Negative facing ETF’s but remember these slowly lose $$ if nothing happens making timing important.
3 – Gold, no change here we like gold in this low interest rate environment but it feels stretched around $US1500/oz.
4 – Defensive style stocks that pay a sustainable yield, they should outperform and combined with the above mosaic theoretically generate some positive returns even in a shaky time.
One of the most underestimated parts of the above is piece of mind, we often say invest to sleep but in this case if an investor has been positioned in a comfortable manner it will be far easier to step up and buy a falling market when others are running for the hills e.g. stocks looked pretty sick back in 2011, 2016 and late 2018.
MM is short-term bearish the ASX200.
ASX200 Chart

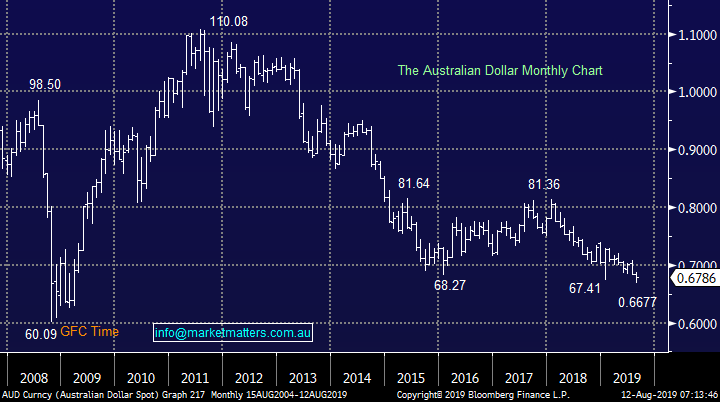
Correlations come and go and although the Aussie dollar is largely regarded as an economic barometer I would question then how come its depreciated so badly over the last 8-years when post GFC economic expansion has largely been solid – copper is over 30% above its 2015 panic low but the $A remains close to fresh decade lows.
Fundamentally there are a number of moving parts with interest rate differentials a huge influence – perhaps the US will start slashing rates back towards zero and / or President Trump will follow through on his threat to devalue the $US. We called the $A below 70c a few years ago but now it’s arrived we believe it’s time to look ahead, perhaps it’s almost too obvious that’s it going lower if global trade slows.
MM is bullish the $A targeting 80c in the next few years.
Australian Dollar ($A) Chart
Question 2
“While I agree that RIO is a good buy cum div now my question is – will it hold the price going forward as the signs are not so rosy IMO. Please correct me if I am wrong as I too would like to buy RIO before 8/8/19.” - Regards, Phillip W.
Hi Phillip,
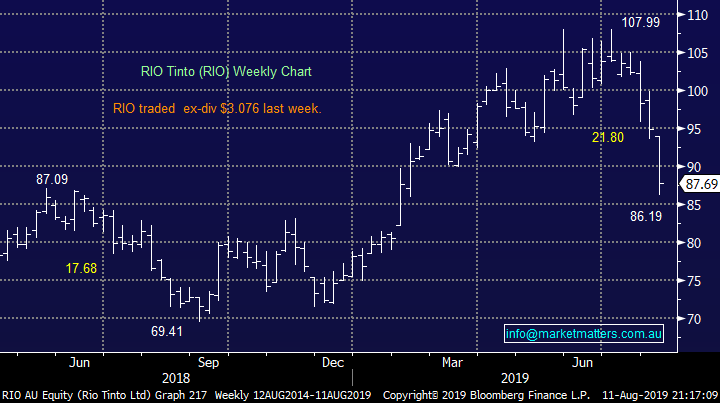
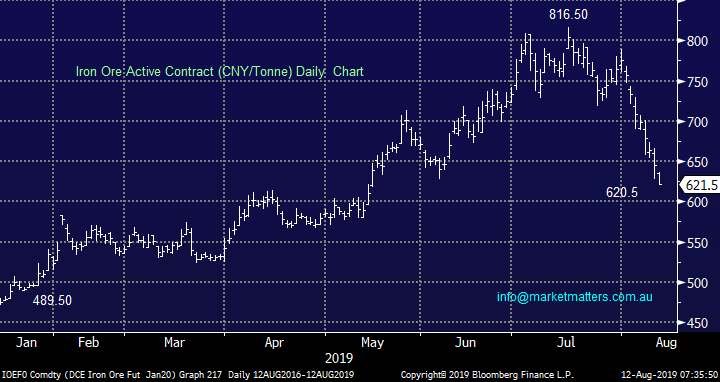
I agree that RIO feels heavy at present but it’s already down 15% from its 2019 high, although that’s not an aggressive correction considering that iron ore has fallen closer to 24% – note we have taken its recent dividend into account with these numbers.
We felt the correction in iron ore was inevitable hence we had no position until recently i.e. we have bought the panic sell-off now let’s see how good our timing has been. The iron stocks of BHP, RIO and Fortescue (FMG) has been a very crowded /popular space so the current shake-up is understandable however how far through the washout cycle we are is harder to pinpoint. We believe the sector has more good years ahead of it with large cash dividends / capital management although the cycle is maturing taking stock volatility higher.
MM likes RIO at current levels.
RIO Tinto (RIO) Chart
Iron Ore Chart
Question 3
“Hi, Fortescue Metals (FMG) what are ur thoughts on that” – Tim W.
Morning Tim,
Fortescue (FMG) is in a similar position to RIO but on steroids! FMG has corrected 31% to-date, almost dancing the tango with the iron ore price. Only last week Twiggy Forrest implied more special dividends / buybacks are still on the menu for this bulk commodity producer, with an Est P/E for 2019 well below 10x and a yield around 6% fully franked MM believes when you look through the fog of panic selling the value remains solid, especially below $7.
MM is bullish FMG at current levels.
Fortescue Metals (FMG) Chart

Question 4
“Hi James and team, with the markets in such turmoil at the moment, one of the more solid elements in my portfolio are my bank hybrid holdings. However as my hybrids are floating rate, I am assuming that the return on these will be hit should the RBA cut rates again...You had mentioned that you were looking at sharing your current thoughts on the hybrid market, so I'd welcome any updates to your thinking in this space.” - Cheers Craig D.
Hi Craig,
Thanks for the welcome and timely nudge on MM hybrid report, I will definitely address this issue on Wednesday. You are correct in saying that floating rate hybrids will yield less as interest rates fall given they are linked to the bank bill rate, however they do maintain their margin over and above that rate which proportionally becomes more significant as interest rates plumb lower levels. Of more influence I think in the short term, is the movement in credit spreads – a topic I’ll cover on Wednesday along with best pics in the sector at the moment.
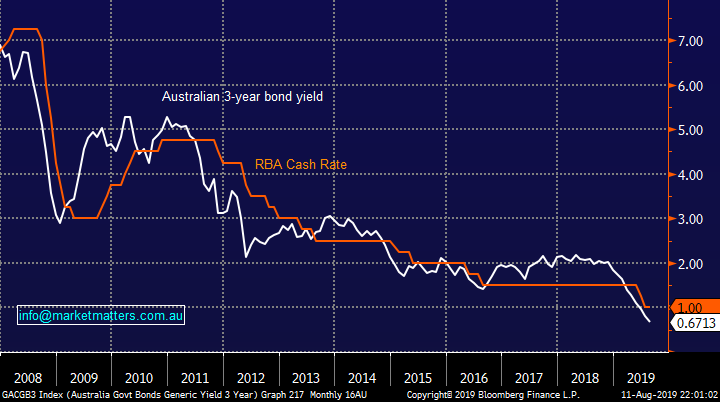
MM still sees the RBA cutting rates further while the 3-year bond yield remains under the cash rate.
RBA Cash Rate & Australian 3-year bond yield Chart
Question 5
“Hi, one of your recent reports said that you expected APX to make a correction. Can you tell me the technical details of why you anticipated this?” - kind regards Guy DB.
Hi Guy,
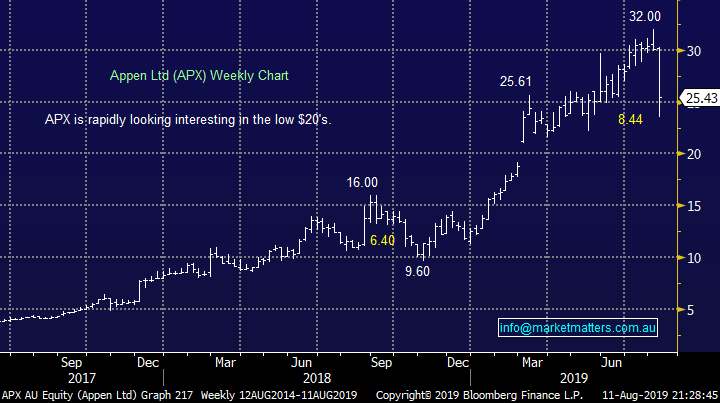
A mixture of value and technicals led us to the risk / reward opinion, we were targeting another pullback of ~$7 which has already been more than satisfied:
1 – In our opinion the values of many of the Australian IT sector were way too optimistic and its easy to argue they still are, when markets wobble the well owned momentum stocks simply correct the hardest e.g. APX has now fallen 26%.
2 – The technical picture was ringing alarm bells as opposed to sell signals following its strong rally from Q4 of 2018.
If we see the US NASDAQ fall another 6-8% the risk / reward will probably return to the buy side in our opinion.
MM is neutral APX at present but it will be interesting around $20 for a sharp bounce.
Appen Ltd (APX) Chart
Question 6
“Hi Guys I have been watching RURAL FUNDS GROUP (RFF) for some time waiting for a pullback in price. at the time of writing they have slumped 40% this seems extreme. I am unable to find any reason for the large fall. I was hoping you might have some information on why the price has moved so much.” - Cheers Heath
Morning Heath,
RFF has certainly been one hot potato, 2 important issues unfolded over the last week:
1 – Short seller Bonitas Research accused RFF of some dodgy accounting.
2 – The stock went into suspense after plunging over 40% but over the next few days insiders like the MD bought over $1m worth of stock as a sign that California based short seller might have their numbers wrong.
MM thinks RFF is simply too hard, more clarity is required before we decide to be brave with this one.
Rural Funds Group (RFF) Chart

Question 7
“Hi James & M&M, you have indicated that CBA may reach the $85.00 mark, do you have any estimate of what levels the other banks (ANZ, WBC, NAB, BOQ) in the M&M Growth Portfolio may reach? Also in the previous year M&M subscribers received a list of specific reporting dates for each of the main ASX 200 listed companies, will you be able to do this again for this reporting season.” - Cheers Tony.
Morning Tony,
Firstly, I have included the company reporting dates at the beginning of today’s report.
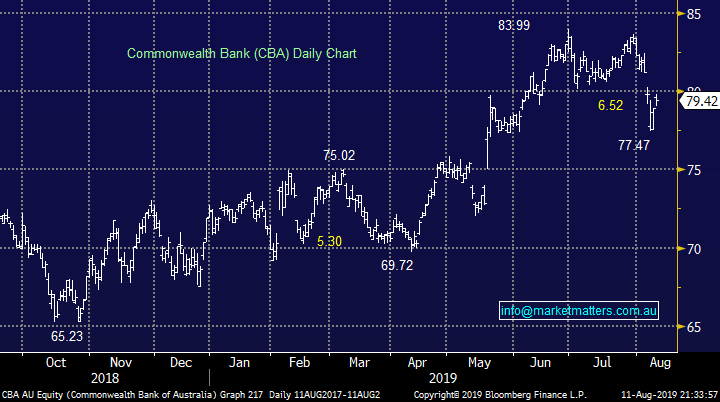
Moving onto the banks, CBA reported slightly below expectations which is never good after trading strongly into the release, the bank fell 3% for the week pretty much the average for the sector. CBA trades ex-dividend $2.31 fully franked this week which is clearly going to make any challenge of the $85 area a tough ask in the short-term. Also the last time Australia’s largest stock corrected over $5 it was during a 3-month consolidation period, a similar sideways quarter now feels likely.
At this stage I see no reason that the big 4 banks don’t move in relative unison hence another 7-8% upside is our target but we don’t expect any fireworks soon as they need a rest following their strong 4-months advance.
Commonwealth Bank (CBA) Chart
Question 8
“Hi MM Team, I note the comment with respect to averaging the long $A position in the ETF portfolio. Recently I have heard calls that we could see $0.55 if the economy falls into recession. Iron Ore looks to have topped out, and further rate cuts are likely to put our dollar under further pressure. Sure rate cuts in the US could have a similar effect of their currency, but the US$ is seen as a reserve currency and hence is likely to hold up better (especially if the global economy goes pear shaped). Trade wars are likely to also hurt our dollar given our reliance on China. leaving aside 'elastic band theory', what economic / market factors do you believe will push our dollar higher? Secondly, is there a way to short the IT sector on the ASX - looks like reality will really start to bite their soon.” - Warm Regards Scotty T.
Hi Scott,
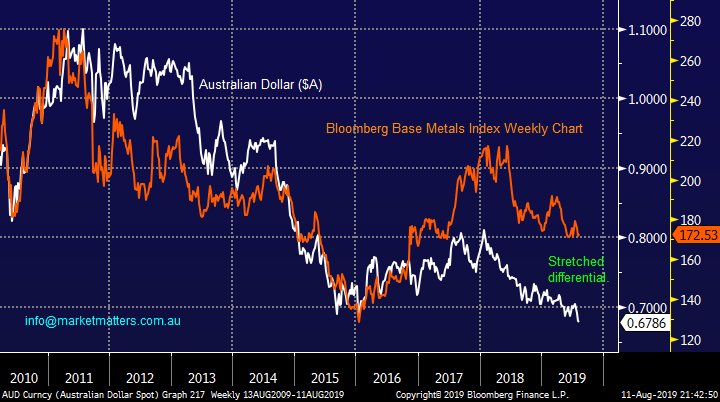
We have touched on the $A earlier today, as you say the iron ore price does look to have topped but the $A wasn’t sucked in by its event driven rally so I’m not sure it will follow it lower, assuming it’s not into the abyss. A number of commonly followed correlations to forecast / value the $A are looking a touch flawed at present, the $A has not been tracking base metals higher as the chart below illustrates.
Like equities the $A is in our opinion largely about interest rates at present.
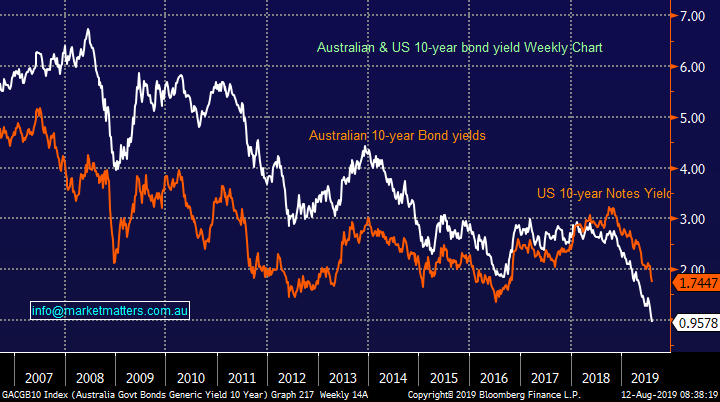
MM feels the crowd is short the $A for all the reasons you mention above but we can see the interest rate differential between US and Australian bond yields revert and eventually we may even see our own back above the US , the norm of recent decades – we feel this will eventually create a positive tailwind for the $A.
As for the IT Sector its probably easiest to look at them on stock by stock basis if you want to short them or simply sell the US NASDAQ, the correlation is extremely strong.
Australian Dollar v Bloomberg Base Metals Index Chart
US and Australian 10-year bond yields Chart
Question 9
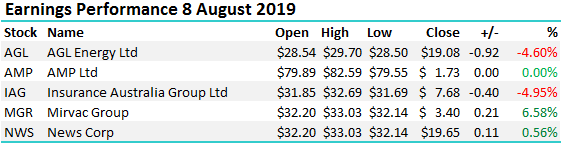
“Hi, Can you please explain the table headed “Earnings Performance…” below? Doesn’t make obvious sense to me.” – Regards Oliver R.
Morning Oliver,
It was some ‘value add’ from Alex while I was away however it simply refers to the daily share price performance of the companies that reported earnings that day. I like it, and will continue to put in the afternoon note through reporting.
Question 10
“Hi guys, is there a platinum ETF (ASX or NYSE) you would recommends?” - Chris G.
Hi Chris,
Consider the Aberdeen Standard Physical Platinum Shares ETF which looks to follow the underlying bullion price: https://www.etf.com/PPLT
Platinum (XPT) Chart

Question 11
“Good afternoon. I know nothing about BBOZ or SH.US, except that they are somehow shorting the market? MM mentions considering buying into BBOZ but as yet has not- why? What are the risks buying into these ETFs? Do they pay dividends? Is there an alternative to SH.US available on the Australian stock exchange? How can I get some more information on these ETFs” – Jenny & John V.
“Guys, The market had a 2 bad days last week, only to recover and bounce back like the trade war blip had never occurred. But increasing commentary, and notably, the weekend AFR is full of doom and gloom over China v USA and how much worse it will get. Should we be loading up on BBUS, BBOZ at this stage in your mind, with that being the obvious way to make a return on a declining market, or is your sentiment not as negative as some commentators are indicating?” – Charlie N.
Morning Guys,
Thanks for a question that may have confused a few subscribers, a couple of quick points:
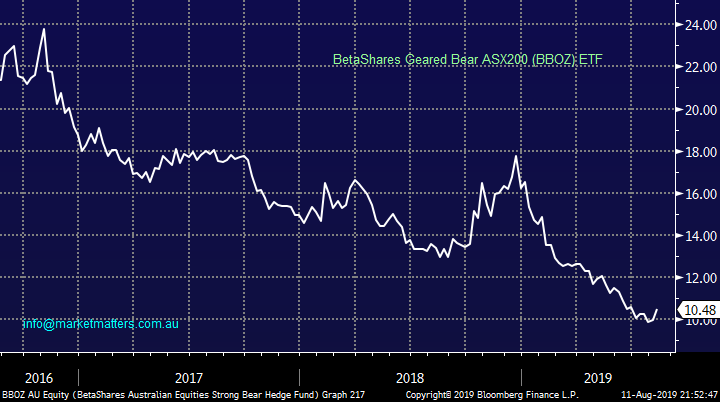
1 – The obvious risk of buying the BBOZ is it needs the ASX200 to fall to make $$, its pays no dividends and actually incurs an effective small cost to hold it, comparable to say time decay on a put option. It simply goes up when the market falls, in a leveraged manner, last week the ASX200 fell -4.8% at its worst while the BBOZ gained over 11% at its best - NB with leverage comes increased risk.
2 – When markets do correct and the purchase is well timed the BBOZ performs excellently but if you are believers in the stock market long-term, as we are, they should only have the very occasional place in a portfolio.
3 – BetaShares themselves explain the BBOZ ETF very well throw the following link: https://www.betashares.com.au/fund/australian-equities-strong-bear-fund/
There are numerous ETF’s available on the ASX and for the keen the link to the entire list is: https://www.asxetfs.com/
MM is watching the BBOZ very carefully but as the chart below illustrates it remains very close to its 2019 low, over 40% down since the Christmas bottom due to leveraged nature of the product. At this stage of proceedings we would actually prefer being short US equities over our own.
BetaShares Geared Bearish ETF (BBOZ) Chart
Question 12
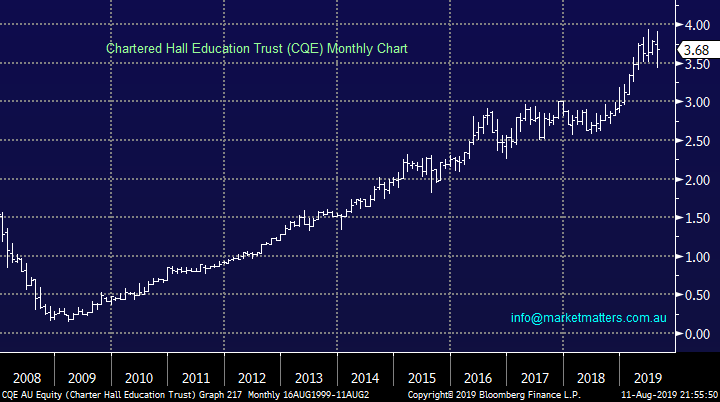
“Hi I wonder if you could review the latest CQE FY19 result. Since the result was released the share price increased by 4% only to lose it the next day. Can you explain why this occurred ? This stock has been very consistent performer over the last 5 years though the NTA growth this year is lower.” - Thanks Kenneth C.
Hi Kenneth,
They reported inline with expectations however the day following the result, JP Morgan cut their target price marginally (by 1.4%) to $3.65 implying that the shares are fully valued at current levels. CQE also announced they were broadening the scope of investments they could hold by tweaking their mandate to include social infrastructure following their announced purchase of the Brisbane Bus Terminal in June.
MM is neutral CQE at present
Charter Hall Education Trust (CQE) Chart
Question 13
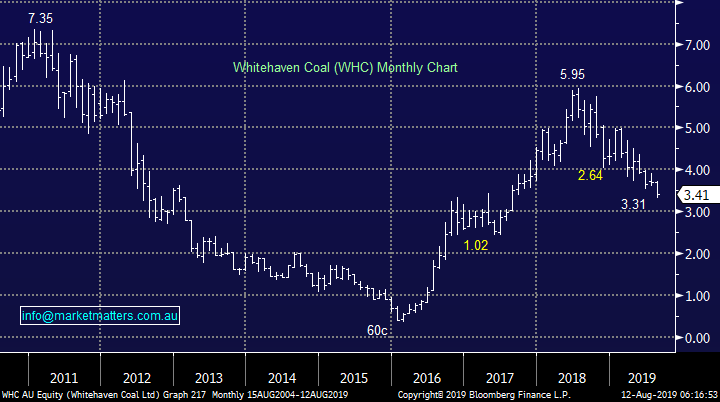
“Hi James, I would like your view on WHC. I bought in at a similar price to yourself. Do I sell, hold or buy on the current weakness?” – David M.
Morning David,
A tricky question and one I have asked myself a number of times in 2019.
The stocks remains cheap on normal matrices and is yielding strongly in a low interest rate environment but the shares continue to drift lower, following the Coal price hence the quandary.
My conclusion remains to hold at this stage but we are not adding.
Whitehaven Coal (WHC) Chart
Overnight Market Matters Wrap
· The US closed in the red last Friday as the US-China trade spat continues with Trump saying that a planned dialogue in September could be called off. Meanwhile the US is putting together its list of Chinese products about to be hit with a 10% tariff.
· Metals on the LME were weaker, with nickel falling from a 16 month high over doubts around an export ban from Indonesia. Crude oil rallied while gold fell below $US1500/oz.
· BHP is expected to underperform the broader market after ending its US session off an equivalent of 1.25% from Australia’s previous close.
· The September SPI Futures is indicating the ASX 200 to open marginally lower, testing the 6575 level this morning.
Have a great day!
James & the Market Matters Team
Disclosure
Market Matters may hold stocks mentioned in this report. Subscribers can view a full list of holdings on the website by clicking here. Positions are updated each Friday, or after the session when positions are traded.
Disclaimer
All figures contained from sources believed to be accurate. Market Matters does not make any representation of warranty as to the accuracy of the figures and disclaims any liability resulting from any inaccuracy. Prices as at 12/08/2019
Reports and other documents published on this website and email (‘Reports’) are authored by Market Matters and the reports represent the views of Market Matters. The MarketMatters Report is based on technical analysis of companies, commodities and the market in general. Technical analysis focuses on interpreting charts and other data to determine what the market sentiment about a particular financial product is, or will be. Unlike fundamental analysis, it does not involve a detailed review of the company’s financial position.
The Reports contain general, as opposed to personal, advice. That means they are prepared for multiple distributions without consideration of your investment objectives, financial situation and needs (‘Personal Circumstances’). Accordingly, any advice given is not a recommendation that a particular course of action is suitable for you and the advice is therefore not to be acted on as investment advice. You must assess whether or not any advice is appropriate for your Personal Circumstances before making any investment decisions. You can either make this assessment yourself, or if you require a personal recommendation, you can seek the assistance of a financial advisor. Market Matters or its author(s) accepts no responsibility for any losses or damages resulting from decisions made from or because of information within this publication. Investing and trading in financial products are always risky, so you should do your own research before buying or selling a financial product.
The Reports are published by Market Matters in good faith based on the facts known to it at the time of their preparation and do not purport to contain all relevant information with respect to the financial products to which they relate. Although the Reports are based on information obtained from sources believed to be reliable, Market Matters does not make any representation or warranty that they are accurate, complete or up to date and Market Matters accepts no obligation to correct or update the information or opinions in the Reports. Market Matters may publish content sourced from external content providers.
If you rely on a Report, you do so at your own risk. Past performance is not an indication of future performance. Any projections are estimates only and may not be realised in the future. Except to the extent that liability under any law cannot be excluded, Market Matters disclaims liability for all loss or damage arising as a result of any opinion, advice, recommendation, representation or information expressly or impliedly published in or in relation to this report notwithstanding any error or omission including negligence.