Subscribers questions (SIQ, WTC, BIN, CPU, LNK, WBC, GMG, AAPL US, CGC, SFR, OZL)

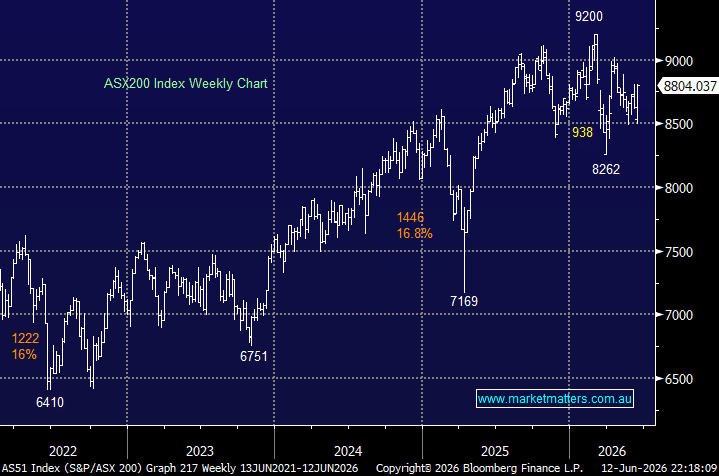
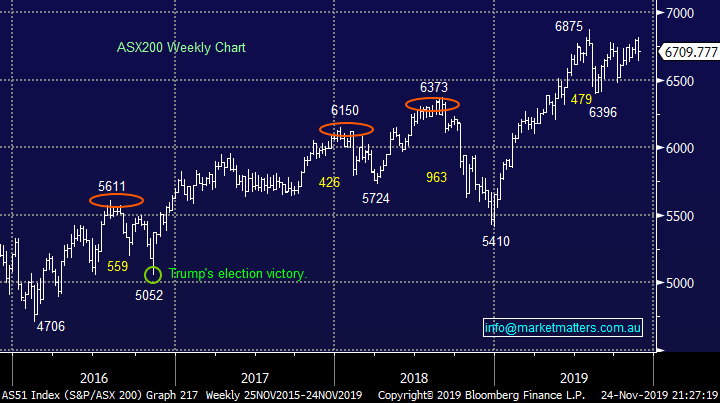
The ASX200 continues to trade in the same 479-point range which has comfortably contained the market since mid-June, statistically speaking the market is not surprisingly overdue a breakout in one direction but second guessing has proved fraught with danger. As we said in the Weekend Report this is a market where investors should focus on stock / sector positioning as opposed to index movements – at MM we are looking for value to outperform growth / defensives in 2020, a position that’s coming in and out of vogue a bit like the British weather!
Fresh news was again relatively thin on the ground over the weekend but it looks likely to have a net positive impact on stocks, only 3 subjects caught my eye, President Trump must have used up his quota of tweets for the month:
1 – Another extremely strong weekend of property auction results with this November looking set to be the strongest since 2016 – basically inventory is fairly thin on the ground while buyers have remained on the front foot, a bullish combination.
2 – We feel the Westpac (WBC) board looks likely to lose some members shortly, from a shareholder perspective it’s probably a case of the sooner the better.
3 – China has upped the penalties on IP (intellectual property) theft, a huge compromise in its trade talks with the US and one we feel that’s likely to rally the S&P’s futures this morning.
MM remains comfortable with a neutral stance around current levels.
On Saturday morning the SPI futures were pointing to a mildly positive opening by the ASX200 with the resources likely to lead as BHP finished up ~25c in the US.
Thanks again for the questions, a definite kick up in volume with Westpac (WBC) becoming the topic of the day courtesy of its awful AUSTRAC scandal.
ASX200 Index Chart
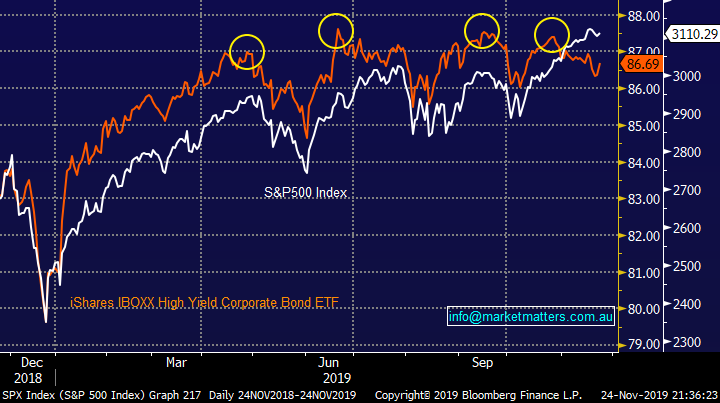
In the weekend report we pointed out our short-term concern for equities due the weakness in Junk Bonds, a phenomenon which has previously preceded pullbacks as illustrated below.
MM believes investors should be open-minded to a ~5% pullback in stocks.
S&P500 v iShares High Yield ETF (Junk Bond) Chart
Two other markets have caught our eye, both imply that more risky money is pulling back and the indexes are being led higher by a diminishing number of quality assets e.g. in the US Apple (AAPL US) and Microsoft (MSFT US) but how far can they go before investors take some $$ off the table?
1 – Bitcoin is making multi-month lows as investors / traders lose faith in this very alternative asset class.
2 – The S&P500 continues to significantly out perform the small cap Russell 2000 again illustrating the more speculative $$ has gone into hiding.
Without the speculative $$ to keep pushing stock valuations higher a pullback now feels an ever increasing possibility.
Bitcoin ($US) Chart

S&P500 v Russell 2000 Index Chart

No change around bonds, MM believes US bond yields have shown their hand and are headed lower e.g. US 10-years to test ~1.4%.
The close back below 1.85% has triggered sell signals for MM targeting a test and probable break of 1.4%, this is very likely to produce a period of outperformance by defensives – a move MM will fade as we believe bond yields are “looking for a low”.
NB If we see US bond yields make a fresh 2019 low the MM Global Macro ETF Portfolio is likely to take a position fading the move in a US bond ETF.
US 10-year Bond Yields Chart

Question 1
“Hi James and Team. Thanks for continuing excellent coverage of both the macro and micro elements of the markets. One matter that could help further is some additional opinion/comment in your evening reports on whether stocks that have dropped significantly on the day now represent good buying value (margin of safety), or if not, what even lower price should a trader/investor look for to buy at. Two examples in the last few days where such comment did not appear was SIQ (SmartGroup) and WTC (Wisetech), where despite your silence I have chosen to purchase some SIQ hoping for a short term uplift on an over-reaction, whereas with WTC I am still watching it closely.” - Regards, Gil.
Hi Gil,
Thanks for the positive feedback and importantly constructive thoughts, we are continually striving to improve the MM offering and hence totally appreciate ideas to assist in the ongoing goal. We do usually attempt to address most ASX200 stocks who have had major moves in the MM afternoon report but more detail analysis leading to specific opinion is clearly required at times, we will endeavour to improve this when possible but obviously at times we do like to digest the news overnight and discuss in the morning note, still allowing plenty of time for action.
With regard to the 2 stocks you’ve mentioned:
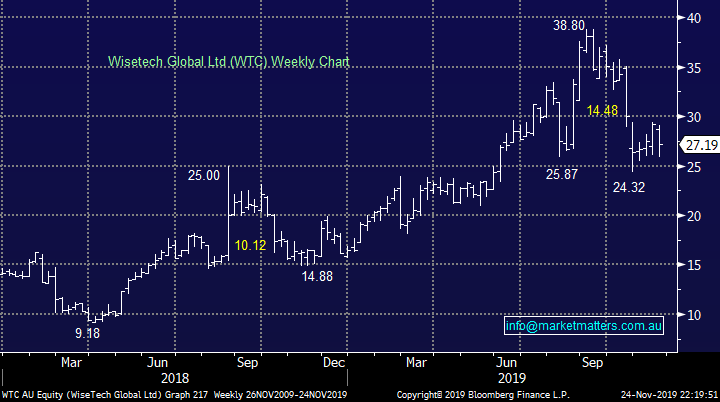
1 – Wisetech (WTC) $27.19 – we have touched on this cloud based logistics software business over recent weeks and our view has not waivered – MM likes WTC as an aggressive play below $24, or over 10% lower.
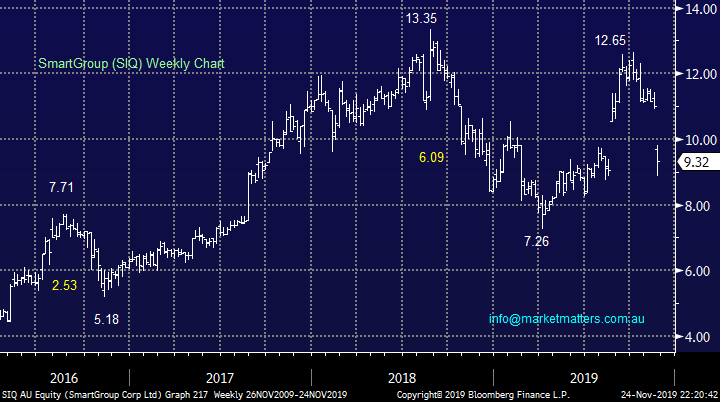
2 – SmartGroup (SIQ) $9.32 – the salary packaging company was smacked last week after announcing an in-line trading update and the stepping down of its long standing CEO. The respected departing CEO has been with the company for 19-years although early indicators are the transition looks to have been well thought out. Investors are clearly focusing on the combination of the fear of the unknown and the potential fresh 2.5% overhang of shares in the business but we question whether this warrants the huge stock revaluation.
We believe the sell off in SIQ is overdone and we are considering a purchase.
Wisetech Global (WTC) Chart
SmartGroup Corp (SIQ) Chart
Question 2
“Hi MM I have held on to BIN from earlier in the year. With their AGM update being positive and your view "bullish BIN after today’s news". ($3.01 share price will have me 100% up). Not to sound greedy -Should I Sell or hold for further upside. Should I be long BIN? Any further gains in this stock will help towards losses made in CGC, ORE & ABC.” - regards Debbie.
Hi Debbie,
Obviously we cannot give Personal Advice hence our comments are purely around how we see BIN moving forward – a stock in hindsight we were way too fussy with when it pulled back towards the $2 area in September.
Both the business operationally and stock technically look solid but clearly its already up ~50% over the last few months. We expect the shares to now “take a breather” and rotate around the $3 area into 2020, a break below $2.70 would be a concern technically.
MM is neutral to bullish BIN around current levels.
Bingo Industries (BIN) Chart

Question 3
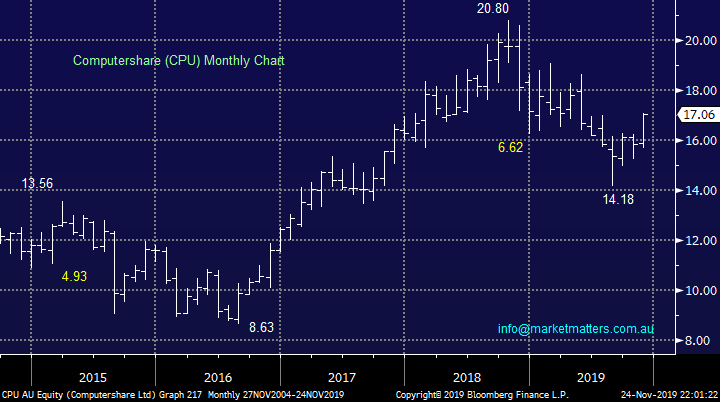
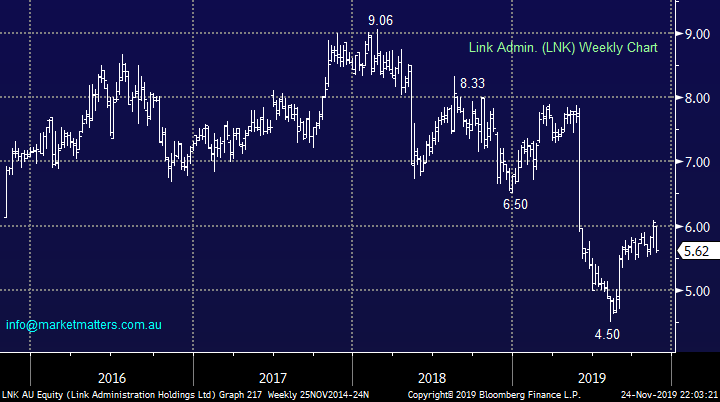
“LNK vs. CPU What's your take on each of LNK and CPU and against each other and also for the category? I read that the new ASX blockchain system might be a risk for both since it potentially sidelines them from share registry type services or at least diminishes their role in it.” - Cheers! Dave B.
Hi Dave,
An fascinating question on 2 companies that have corrected significantly from their 2018 highs – 32% for Computershare (CPU) and 50% for Link Admin (LNK). The blockchain technology certainly does throw up risks in this space especially as it would appear that the ASX Ltd (ASX) has aspirations of vertical integration moving forward i.e. potentially controlling the market place and share registries.
We like to combine both fundamentals and especially technical risk / reward evaluation when this degree of disruption is a foot. Firstly we prefer CPU over LNK across both levels and interestingly on a technical level CPU actually looks excellent.
MM likes CPU with stops below $16, or ~6% risk.
Computershare (CPU) Chart
Link Admin. (LNK) Chart
Question 4
“In today's report it was advised that someone who had bought Westpac on 1 November would be eligible to take up the share offer. I bought shares on 1 November and phoned Westpac to take up the offer and was told I did not qualify because although I had bought the shares on 1/11 I only entered the register several days later. Please can you clarify this point for me.” - Thanks. Hylton S.
Hi James, would it be reasonable to assume that Westpac may be sitting in the box seat for a class action by the likes of Slater and Gordon from both institutional and retail investors over the latest SPP. Seems likely that there are some non-disclosure aspects of the AUSTRAC investigation well before the SPP hit the screens. As you say 'opportunistic' could be a fitting description. Obviously even for a bloke in your position you were a bit in the dark on this one as were many other insto's.” - Thanks Steve S.
Hello, I am a Westpac shareholder, took up the offer and read so did MM. I do not remember reading about their paedophile trading patterns as in this disaster was not disclosed. Am I correct? If so, can we abort the take up in their share offering? Or can they mislead potential investors, not sack their CEO, take their bonuses and get away with it? If the latter, I am definitely in the wrong profession.” – Thanks John T.
Hi Guys,
Westpac (WBC) has certainly disappointed many Australians last week from customers through to shareholders plus simply “the man on the street”. I’ll avoid going into the details of the AUSTRAC claims but while I do feel WBC will be found guilty of allowing money laundering to function through its operations I’m not convinced they had any idea child exploitation was involved but of course by definition it was highly likely to be of an unsavoury nature on some levels – as the law says “ignorance is no excuse”.
I have addressed the points raised above in simple bullet form to increase efficiency:
1 – I’m unsure why you’re not entitled to the WBC SPP if you bought stock on 1/11 before the results and the raise was announced. Usually the record date is timed so that all those who bought stock before the announcement are on the record to participate. It would be like saying to an investor that bought the stock the day before the ex-dividend date that they are no entitled to the dividend. I’ll look into this further.
2 – A class action is always a potential especially as it makes the lawyers a lot of $$ but the stock is only 1.7% below the institutional raise price, hardly a dramatic loss just not the “easy money” we all hoped for. Importantly, the SPP is priced as a discount to the average price during the pricing period so retail investors are now likely to pay less than the insto’s in this raise.
3 – As I alluded to earlier I will be surprised if the board survives fully intact over the next couple of weeks.
Westpac (WBC) Chart

Question 5
“Hi, I have recently cashed out my holding in one of the property trusts and am wondering about reinvesting that money back into property or infrastructure. I'd appreciate your thoughts from an income and growth perspective?” - regards Michael B.
Hi Michael,
A reminder that any advice here is general only and doesn’t take into consideration individual investors circumstances.
Your certainly not alone looking for income and growth in today’s environment especially as term deposits have plunged below 1.5% and the RBA looks set to drop the cash rate further to 0.5% in 2020. However importantly MM is looking for a bottom in bond yields in the next few months although we don’t expect official interest rates to increase anytime soon.
If we are correct in our assessment a period of underperformance by the defensive / yield play space is likely – no great call after their impressive rally since early 2018. However we are expecting some fiscal stimulus next year which should benefit a number of infrastructure stocks hence that’s now our preferred vehicle out of the two – MM has bought a couple of the less traditional names in recent times for our Growth Portfolio, Service Stream (SSM) and NRW Holdings (NWH) with the former paying a decent forecasted 4% fully franked yield.
MM prefers infrastructure over property into 2020.
RBA Cash Rate Chart

Question 6
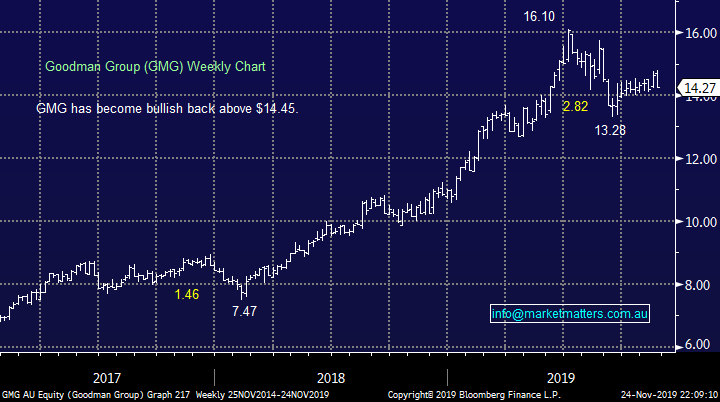
“For members questions please Looking at warehouse/ logistic stocks and recognise that GMG is a significant operator. Could you please consider alternatives- ? IDR and smaller companies who may offer some growth.” - Gayle C.
Hi Gayle,
I think the chart below of Goodman Group (GMG) illustrates that large companies can attain some growth in both its share price and business although in the short-term we believe classic “yield play” stocks like GMG is at the mercy of bond yields.
GMG is forecasting growth over the next 12 months of 9% and we do like the stock.
We covered some thoughts on GMG in a recent income note: click here
I’ll look to cover some of the smaller players in coming notes.
Goodman Group (GMG) Chart
Question 7
“Apparently Mr. Buffet is selling quite lot of his Apple shares. Does that change your thinking?” – Waz.
Morning Waz,
Mr Buffett may have sold a few shares in the 3rd quarter but his position still increased above $US6bn due to share price appreciation, to us this move is just a rebalancing not a change in opinion by Berkshire. Also his stake in the company increased from 5.52% to 5.6% because of stock buybacks.
NB Just because the legendary US investor sells doesn’t mean we will follow suit, we follow our own research and opinions.
MM is still bullish AAPL although a small pullback is overdue.
Apple (AAPL US) Chart

Question 8
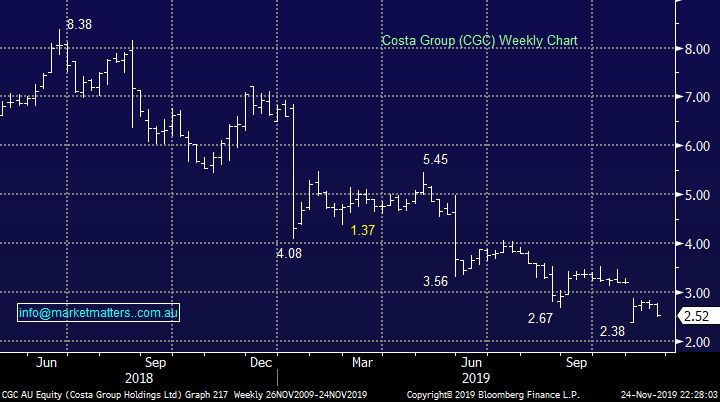
"Hi, noticed you are holding CGC in the Growth Portfolio, purchased at 4.51 on 28/2/19…..currently at 2.64 …. a loss of around 40%. ….and I believe at the moment you have got it as a BUY. The stock hit a high (8.38) in June 2018 but has been in decline ever since…..falling around a whopping 70% ….would fit in the “dog” category. Right now on the daily chart attached above, (since 31 Oct) it’s trading sideways, within a narrow horizontal channel (between 2.58 and 2.87), and leaning to the bearish side. Would first need to break and hold above the channel (2.87) before even contemplating it an early prospect. This stock would then need to confirm a clear turnaround (indicators pointing bullishly up), establishing an uptrend on the WEEKLY chart (attached above), before giving it any consideration to BUY. Matched by improvement in market sentiment and sound fundamentals, particularly revenue and earnings forecasts. If stock ever decides to go up and fill gap at 3.21 it will probably find strong resistance around that level. So I can try to understand your rationale, why did you buy and have been holding on to CGC for so long, whilst it has continually been declining, with negative market sentiment and disappointing results? ….. I avoid catching a falling knife like CGC. Also, what is your exit strategy or sell guideline?” - Cheers Tony M.
Hi Tony,
Undoubtedly not our proudest investment, fortunately the balance of our portfolio over the year has outperformed the ASX maintaining strong returns. With regard to CGC we can only evaluate the stock / business with information to hand, unfortunately as the chart below illustrates on more than one occasion the company has shocked the market, including ourselves.
We recently reduced our position around $2.70 level which obviously looks ok today, moving forward we now see the stock rotating between $2 and $3 as they reorganise there business model i.e. stop depressing their own markets with increased supply! Hence we currently plan to invest accordingly but I do understand your thoughts, it would be easy to walk away and say too hard but MM does see value in the berry and mushroom business into 2020.
Costa Group (CGC) Chart
Question 9
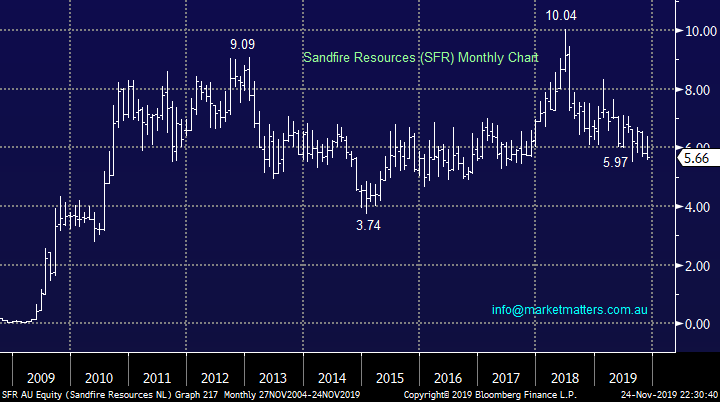
“Hi James, Firstly you guys are doing a great job, things are tricky out there. My question concerns SFR, on a recent video shot at Shaw there was some talk of buying SFR over OZL as it offers more upside . Did I understand this correctly ? And what is your thoughts on SFR. David M.
Morning David,
We really appreciate positive feedback, always a nice way to start the week.
MM believes OZL is a higher quality business than SFR hence we own the stock in our Growth Portfolio, following our view that copper is set to recover into 2020. However if copper does pop significantly higher moving forward SFR might well rally harder simply because its down 40% from its high but we would rather invest in the higher quality business.
MM remains bullish OZL initially targeting $12.
Sandfire (SFR) Chart
OZ Minerals (OZL) Chart

Question 10
“Could you please advise what is the annual return on your income portfolio which I am considering mirroring as part of my investment strategy.” - Mike D.
Morning Mike,
As at the 19th November, the Income Portfolio has added +21.22% since inception on the 5th July 2017, which equates to an annualised return of 8.44% before fees. The benchmark for this portfolio is cash plus 4%, with the benchmark since inception up 12.82%. however worth noting that AXLHA resides in the portfolio and will be written down at some point by around 3%. While the security has not been tradable for well over a year, if we assume the write down takes place early next year, the returns for the portfolio since inception will be reduced by ~3%, implying a number around 18%.
Importantly, volatility and consistency of income is the key in this portfolio and that is achieved through holding stocks as well as other income securities like hybrids, bond funds, and alternative income funds
Question 11
There is a new buy now pay later IPO launching and we’ve had a number of questions about it in the last week. OpenPay is listing on the ASX as a competitor to AfterPay (APT) and ZipCo (Z1P), although with more of a UK tilt - Shaw and Partners are the lead manager*. The prospectus has recently been lodged and can be found here. In my view, there are a couple of competing factors play out for this business. On the positive side there’s big growth from both merchants and users, it’s clearly a growing sector however its now a sector that is ripe for further regulation. Competition is the other factor that is increasing, the listing of OpenPay an example of this however competition from the large incumbent payment platforms is what could really hurt these sorts of companies. On the positive side for OpenPay, they are listing at a deep discount to the existing players – about a 30-40% discount on metrics we look at so is a cheaper way to gain exposure than the existing stocks. Interest has been strong to date and they should easily raise the $50m at $1.60 per share, giving them a market cap on listing of $150m. I have subscribed for a small allocation through the book build for my wholesale clients.
The retail offer opens on the 2nd December, with trading expected on the 16th December.
*Shaw and Partners will earn a fee for their roll as lead manager.
Overnight Market Matters Wrap
- The US equities closed higher last Friday, following both President Trump and President Xi Jinping made positive comments about US-China trade talks with President Trump saying they were “very close” to a deal.
- Investors were also welcomed a slightly stronger US consumer sentiment index, which rose to 96.8 in November from 95.5 in October, and a firmer read on the manufacturing and services index.
- This led the VIX (volatility) index to trade back close to ultra low and complacent levels as risk returns back on the market.
- The emerging markets and its respective stocks are expected to outperform today, including BHP which ended its US session up and equivalent of 0.6% from Australia’s previous close.
- The December SPI Futures is indicating the ASX 200 to open 20 points higher, towards the 6730 level this morning.
Have a great day!
James & the Market Matters Team
Disclosure
Market Matters may hold stocks mentioned in this report. Subscribers can view a full list of holdings on the website by clicking here. Positions are updated each Friday, or after the session when positions are traded.
Disclaimer
All figures contained from sources believed to be accurate. All prices stated are based on the last close price at the time of writing unless otherwise noted. Market Matters does not make any representation of warranty as to the accuracy of the figures or prices and disclaims any liability resulting from any inaccuracy.
Reports and other documents published on this website and email (‘Reports’) are authored by Market Matters and the reports represent the views of Market Matters. The Market Matters Report is based on technical analysis of companies, commodities and the market in general. Technical analysis focuses on interpreting charts and other data to determine what the market sentiment about a particular financial product is, or will be. Unlike fundamental analysis, it does not involve a detailed review of the company’s financial position.
The Reports contain general, as opposed to personal, advice. That means they are prepared for multiple distributions without consideration of your investment objectives, financial situation and needs (‘Personal Circumstances’). Accordingly, any advice given is not a recommendation that a particular course of action is suitable for you and the advice is therefore not to be acted on as investment advice. You must assess whether or not any advice is appropriate for your Personal Circumstances before making any investment decisions. You can either make this assessment yourself, or if you require a personal recommendation, you can seek the assistance of a financial advisor. Market Matters or its author(s) accepts no responsibility for any losses or damages resulting from decisions made from or because of information within this publication. Investing and trading in financial products are always risky, so you should do your own research before buying or selling a financial product.
The Reports are published by Market Matters in good faith based on the facts known to it at the time of their preparation and do not purport to contain all relevant information with respect to the financial products to which they relate. Although the Reports are based on information obtained from sources believed to be reliable, Market Matters does not make any representation or warranty that they are accurate, complete or up to date and Market Matters accepts no obligation to correct or update the information or opinions in the Reports. Market Matters may publish content sourced from external content providers.
If you rely on a Report, you do so at your own risk. Past performance is not an indication of future performance. Any projections are estimates only and may not be realised in the future. Except to the extent that liability under any law cannot be excluded, Market Matters disclaims liability for all loss or damage arising as a result of any opinion, advice, recommendation, representation or information expressly or impliedly published in or in relation to this report notwithstanding any error or omission including negligence.