Subscribers questions (TCL, NCM, NXT, NEA, LCK, QLTA, CRED, XARO, AGL, AST)
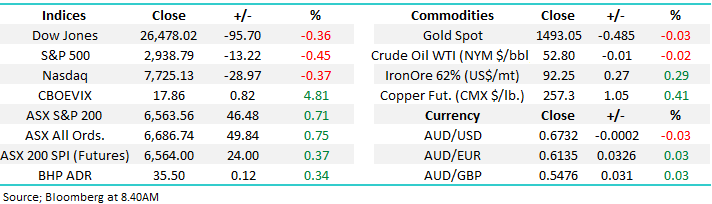
The ASX200 enjoyed a solid start to October’s second week advancing 46-points on a quiet Labour Day long weekend, Victoria kept the boards ticking over but volumes were understandably relatively subdued – Harry had a quiet day on the desk while I enjoyed a weekend up in Terrigal with the extended family.
The broad based buying was actually impressive with only 15% of the market closing in the red, it feels like some investors have got that nagging feeling that the markets pullback last week may be over. On the sector level the IT and Healthcare sectors were the best on ground which is no great surprise as they traditionally embrace lower bond yields, and as we know global central banks remain in a rate cutting cycle.
With President Trump embroiled in impeachment and tax record issues he appears to have let up on his China bashing tweets, at least for now, which has taken some element of day to day surprises out of the market. This has subsequently left stocks focused on the looming US – China trade talks, any indicators that the US economy is losing upside momentum and future rate cuts & QE by central banks i.e. very logical influences on stocks which are pushing and pulling the market in different directions.
The local market appears to be staying with its relative performance rhythm which has been dictated by the Aussie Dollar – when the $A struggles against the $S, as it did yesterday the ASX200 tends to surprise many with its intra-day strength. Traders appear to be buying the local SPI (ASX200 futures) and selling the US S&P500 futures when our currency slips, worth bearing in mind if the $A finally makes an assault to the upside on the 70c area.
No change, MM remains comfortable being relatively defensive, at least for a few weeks / months.
This morning SPI futures are pointing to an opening for the ASX200 up over 20-points as we look to take a -0.4% pullback by US stocks in our stride.
We pushed Monday’s usual Q&A out to this morning, thanks for the questions as always, an interesting collection today.
ASX200 Index Chart

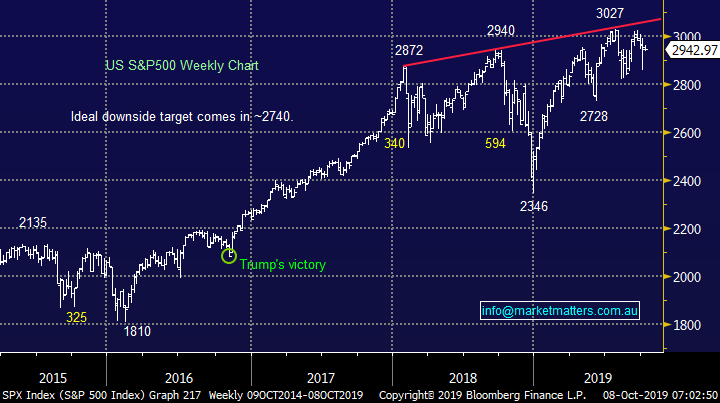
US stocks continue to trade in a very choppy manner, overnight we closed at the same level as the 2018 high formed about a year ago i.e. US stocks have gone nowhere for 12-months although there’s been some huge moves within that year.
While at MM our preferred scenario is US stocks will correct ~6% in the coming weeks there is no longer technical sell signals in play, it’s more of a “Gut Feel” at this stage.
US S&P500 Index Chart
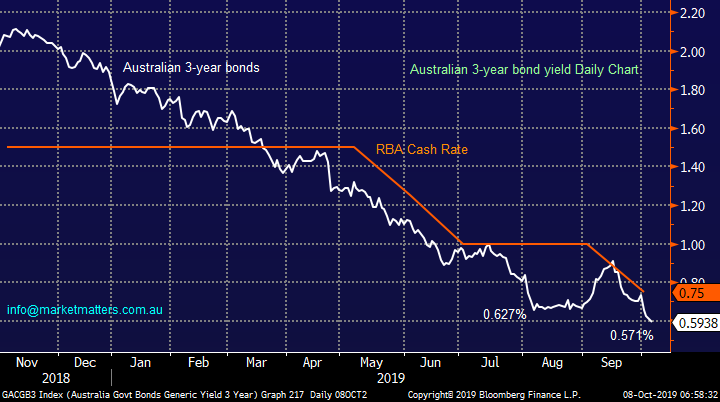
The chart below illustrate Australian bond yields making fresh all-time lows following the RBA’s rate cut to 0.75%, markets are now targeting 0.5% in the months ahead as the Australian central bank appears to be using up all its monetary ammunition in an effort to revitalise our economy.
What will be interesting for stocks is when fund mangers start considering what comes next e.g. will we see rates flat line for quarters to come as the economy struggle’s to gain any traction or will we see another sharp pick up in housing prices, consumer confidence and then spending which will test the RBA’s resolve to leave rates at their historical lows.
MM believes rates may be reaching the nadir on the downside.
Australian 3-year Bond Yields Chart
As we touched on earlier the ASX200 appears to be embracing weakness in the $A on a day to day basis, not great news for stocks if our contrarian opinion on the “Aussie battler” comes into fruition. So far we have a market declining with reduced momentum but definitely no buy signals, a close above 68c might start to make a few reconsider their bearish bets / opinion.
MM remains bullish the $A from current levels both medium and long-term.
Australian Dollar ($A) Chart

Question 1
“Hi, just checking your thoughts on Transurban and Newcrest” – Tim W.
Morning Tim,
Two topical stocks over recent weeks and as subscribers know the later we own in the MM Growth Portfolio while the former resides in our Income Portfolio:
1. Transurban (TCL) $14.69 – TCL is one of the classic “yield play” stocks on the Australian bourse and although the shares appreciation over recent years has taken its yield to 4.2%, slightly franked it remains a lot more attractive than a term deposit!
MM remains bullish TCL targeting a break of the 2019 $16.06 high.
NB We are likely to take our $$ if anticipated this move unfolds.
Transurban (TCL) Chart

2. Newcrest Mining (NCM) $36.03 – this major gold producers shares are not surprisingly highly correlated to the underlying precious metal price. Although the sector is likely to fall ~1% this morning we remain bullish targeting fresh 2019 highs – sounds like TCL!
MM remains bullish NCM targeting the $40 area.
Newcrest Mining (NCM) Chart

Question 2
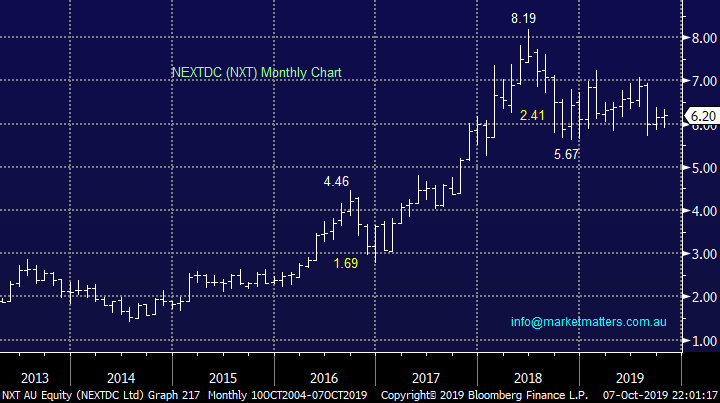
“I hold shares in NXT--loss this year, f/cast loss, next year and (per Commsec) f/cast PE in 2021 of 180! My question is, will the uptake of blockchain affect the uptake of NXT facilities and ,if so, how and why? I could be displaying my ignorance.” - Regards, Chris J.
“Hi Quick question on NXT -and having come out of a dip & on consensus data at market index rated a ‘strong buy ‘ -would you also recommend a buy at current price? I went back through the daily reports to see if you had a view on the stock. Is there a search function using tickers on your website?” - Thanks Gayle C.
Hi Guys,
There’s a lot of water to go under the bridge for this data centre business in the next few years but last Augusts full year results didn’t help the share price which fell almost 10% on the day i.e. a $10m loss on a 15% lift in revenue with forecasts for 2020 of further revenue growth of up to 15%.
The issue as is often the case with growth stocks is valuation, what do you pay for optimism and future growth with no yield while say CBA is paying 5.5% fully franked albeit with little to no growth – the question, is NXT worth over $2.1bn when its losing money? The other issue we see is the market is long this stock already, making it hard to identify the marginal new buyer without any meaningful change to the outlook. Below shows 11 analysts covering, with 10 buys and just one hold.
NXT broker Consensus
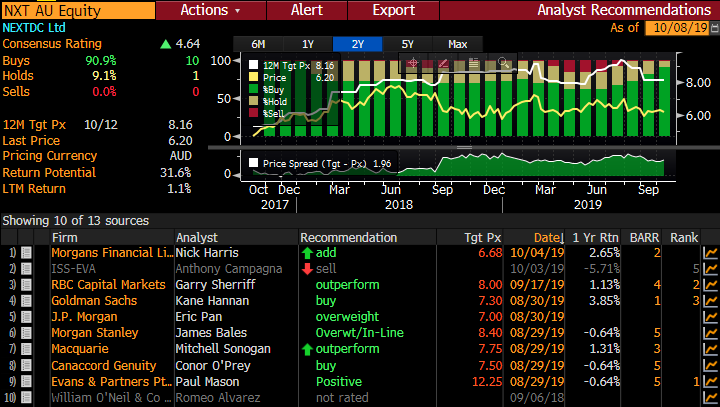
We believe with so many “what if’s and buts” technical’s are very important with these style of stocks to enable us to quantify a degree of risk / reward – technically NXT looks ok around $6 with a potential “abc” target under ~$5. Hence fans of the business could accumulate here with ammunition to average into further weakness.
MM is neutral to positive NXT with stops below $4.40 unfortunately unattractive risk / reward.
NEXTDC (NXT) Chart
Question 3
“Hello, I notice NEA has been on a slide since reporting. August broker targets are around $4+. Would this be a good time to add more NEA to my portfolio? I expected volatility through to early December but it is difficult to see that NEA could go much lower from here.” – Thanks Paul M.
Hi Paul,
Mapping business Nearmap (NEA) has fallen well over 40% from its 2019 high, I’m sure many investors thought that was unlikely at the time, as we repeat at nauseum remain open-minded. NEA has been sliding since June but since it reported an increased loss of almost $15m on revenue above $77m the declines have slowed, the business should be nicely profitable in a few years’ time if it can maintain its US expansion but does this potential expansion make NEA worth over $1.1bn? The main issue is the pace of growth has now slowed and this is a red flag for a growth stock.
Brokers remain largely bullish NEA but at this point in time its feels a 50-50 play to MM. I’d prefer to wait to see the next update from NEA before buying, they have their AGM on the 14th November in Sydney.
MM is neutral NEA.
Nearmap Ltd (NEA) Chart

Question 4
“Hi, Wonder if you may discuss about LCK (Leigh Creek Energy). Thanks and warm regards.” – Victor K.
Hi Victor,
Gas company LCK is not a stock we look at regularly with its market cap of $107m making it prohibitive to MM. The stock is unfortunately clearly a “speccy” having quadrupled and then more than halved in 2019, it’s a merry go round and a half!
Unfortunately at current levels we cannot even quantify a risk / reward opportunity for the brave – sorry its too hard here for MM.
MM is neutral LCK.
Leigh Creek Energy (LCK) Chart

Question 5
“Hi James, Can you advise a major name money market funds investing in AAA short-term paper in the USA exclusively. I understand this is the safest form of investment.” – Thanks Daniel C.
Hi Daniel,
While AAA rated corporate debt is obviously the highest quality and safest, the returns are lower. S&P do have an index called the S&P 500 AAA Investment Grade Corporate Bond Index however from my understanding, there are no ETF’s that provide exposure to it. iShares have an ETF called the A Rated Corporate Bond ETF which is listed on the New York Stock Exchange (NYSE) and traded under code QLTA. It’s not all AAA rated corporate debt, it includes A to Aaa or equivalent and it holds some bonds that are issued by companies outside the US. They hold more than 1500 companies and it’s 5 year return is 4.28%pa while it has a running yield of 3.08%.
iShares AAA -A Rated ETF (QLTA US) Chart

The local option comes under code CRED, which is a Betashares product listed on the ASX which holds investment grade corporate bonds. Investment grade is defined differently between rating agencies however from S&P they have 10 ratings within the investment grade class from AAA down to BB-. This isn’t a AAA product but is investment grade, has a running yield of 3.56% per annum with an average credit rating of A-. They hold up to 35 individual securities which obviously has less diversification than the iShares product, however it is listed om the ASX.
Betashares Australian Investment Grade Corporate Bond ETF (CRED) Chart
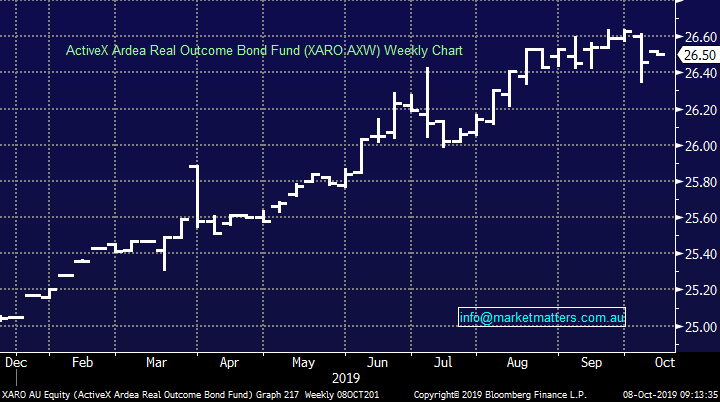
We wrote about an alternative bond strategy in last week’s income note – click here, which we like as an active strategy. This is called the ActiveX Ardea Real outcome Bond Fund which trades under ASX code XARO, and this is being added to the MM Income Portfolio.
ActiveX Ardea Real outcome Bond Fund (XARO) Chart
Question 6
“Hello James and team, Love your work. Do you have a view on the IPO of Latitude Financial? Thanks Dave
“Hi, an opinion on Latitude Financial IPO please.” – Regards Keith T.
Hi Gents,
Latitude are having a second bite at the cherry after trying to list in July 2018 without success, this time they’ve packaged up the big IPO a little differently, and the sales pitch has changed pushing harder at the digital finance angle. They’ve also got a new CEO to sell the deal Ahmed Fahour who used to run Australia Post.
As background, Latitude was a consumer finance business owned by GE which generated the bulk of earnings from teaming up with the likes of Harvey Norman offering interest free terms on TV’s, washing machines and the like. Now they have personal loans, car loans, LatitudePay which is a buy now pay later competitor to ZipCo (Z1P) and Afterpay (APT), however the bulk of their current earnings still come through the old channels with 58% of income from old style instalment products , 28% coming from personal loans, and from what I can tell, only 1% from buy now pay later channels.
They expect to make a $278m cash profit to December 2019 and they’re pricing the IPO at about 13x that profit. It’s a big raise, about $3.75bn, $1bn of which is going to retail investors through a panel of syndicate brokers, unfortunately Shaw & Partners is not one of them so I don’t have as much colour on this deal as if we were involved. Stock is available through Bells, Morgans, Wilsons, CBA, Crestone & Macquarie.
On 13x expected earnings that are growing at 12%, this seems reasonable, however my concern is around its size of the deal – it’s a very big raise and nothing significant has changed with the business since they tried last time, they’ve just got a new sales pitch and a new voice pushing it. From what I hear, stock is not ‘running out the door’
Question 7
“Hi Guys, I don't appear to have access to Bear ETF (DTYS US) through Nab Trade. Do you have a similar alternative?” - Regards, Scott D.
Morning Scott,
Below is a link to 12 inverse US bond ETF’s , I’m not closely familiar with the NAB platform but perhaps simply start with the largest (TBF US) which has assets of over $US250m and work your way down.
https://etfdb.com/etfdb-category/inverse-bonds/
ProShares Short 20+ Treasuries (TBF US) Chart

Question 8
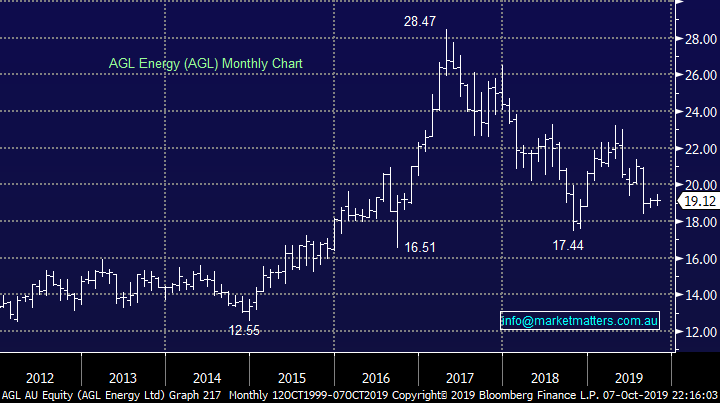
“Hope you can fit this one in on Tuesday. Thanks for the heads up on alerts. Very useful. Does MM have any thoughts on AGL and AST as defensive yield plays in the current market?” - Chris G.
Hi Chris,
Firstly AGL Energy (AGL) which has been a poor performer over the last few years, not a defensive play compared to say TCL we looked at earlier. This household name sells / distributes gas and electricity and has struggled of late, it registered an over 40% drop in profit after tax last FY to $905m and importantly they are forecasting a further fall in earnings for the next year.
AGL currently trades on a P/E of 14.8x for 2020 while paying an estimated yield on 6.3% part franked, most definitely eye catching in today’s low interest rate environment. Technically around $17 AGL will look interesting to MM.
MM does not regard AGL as a defensive stock although it will become interesting ~$17 as “yield / valuation play”.
AGL Energy (AGL) Chart
Secondly Ausnet Services (AST) which has performed strongly post the GFC as global bond yields have continually declined. Another energy service provider that has clearly left AGL in its wake from a performance perspective, the company has raised its dividend for 4 consecutive payouts plus its promising another improvement in 2020 but the stocks valuation is building in some clear further positive news.
AST currently trades on a P/E of 24.7x for 2020 while paying an estimated yield on 5.4% party franked, again eye catching in today’s low interest rate environment. However technically AST has generated sell signals which coincides with our opinion that the bull market for bonds (bearish bond yields) is maturing rapidly.
MM is neutral / bearish AST.
Ausnet Services (AST) Chart

Overnight Market Matters Wrap
- The US equity markets started the week on a soft note, as investors take risk off the table ahead of the US-China Trade meeting this week.
- On the commodities front, copper and aluminium traded higher on the LME, while nickel was slightly lower. Iron ore trading remains closed in in China, while crude oil gave back most of its day’s gains.
- Data today consists of NAB business confidence and the September Caixin China PMI data – expecting a print of 52 today.
- The December SPI Futures is indicating the ASX 200 to open 27 points higher, testing the 6590 level this morning.
Have a great day!
James & the Market Matters Team
Disclosure
Market Matters may hold stocks mentioned in this report. Subscribers can view a full list of holdings on the website by clicking here. Positions are updated each Friday, or after the session when positions are traded.
Disclaimer
All figures contained from sources believed to be accurate. All prices stated are based on the last close price at the time of writing unless otherwise noted. Market Matters does not make any representation of warranty as to the accuracy of the figures or prices and disclaims any liability resulting from any inaccuracy.
Reports and other documents published on this website and email (‘Reports’) are authored by Market Matters and the reports represent the views of Market Matters. The Market Matters Report is based on technical analysis of companies, commodities and the market in general. Technical analysis focuses on interpreting charts and other data to determine what the market sentiment about a particular financial product is, or will be. Unlike fundamental analysis, it does not involve a detailed review of the company’s financial position.
The Reports contain general, as opposed to personal, advice. That means they are prepared for multiple distributions without consideration of your investment objectives, financial situation and needs (‘Personal Circumstances’). Accordingly, any advice given is not a recommendation that a particular course of action is suitable for you and the advice is therefore not to be acted on as investment advice. You must assess whether or not any advice is appropriate for your Personal Circumstances before making any investment decisions. You can either make this assessment yourself, or if you require a personal recommendation, you can seek the assistance of a financial advisor. Market Matters or its author(s) accepts no responsibility for any losses or damages resulting from decisions made from or because of information within this publication. Investing and trading in financial products are always risky, so you should do your own research before buying or selling a financial product.
The Reports are published by Market Matters in good faith based on the facts known to it at the time of their preparation and do not purport to contain all relevant information with respect to the financial products to which they relate. Although the Reports are based on information obtained from sources believed to be reliable, Market Matters does not make any representation or warranty that they are accurate, complete or up to date and Market Matters accepts no obligation to correct or update the information or opinions in the Reports. Market Matters may publish content sourced from external content providers.
If you rely on a Report, you do so at your own risk. Past performance is not an indication of future performance. Any projections are estimates only and may not be realised in the future. Except to the extent that liability under any law cannot be excluded, Market Matters disclaims liability for all loss or damage arising as a result of any opinion, advice, recommendation, representation or information expressly or impliedly published in or in relation to this report notwithstanding any error or omission including negligence.