Subscribers questions (WBC, AMZN US, JHG, CGC, TGF, CGF, HLS, FMG, RIO)
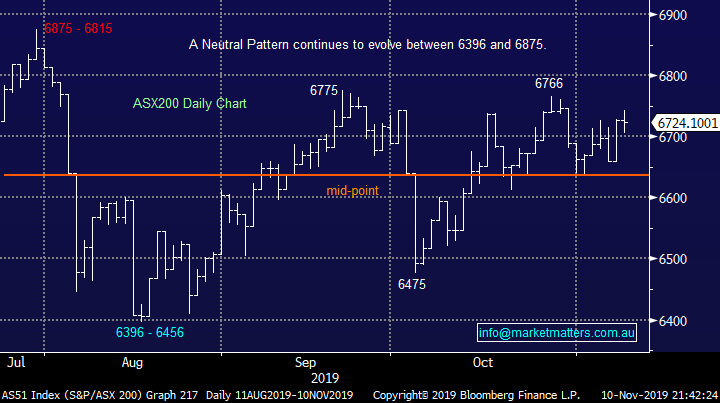
The ASX200 remained in its entrenched trading range last week as the market feels almost anchored to the 6700 area by a tight and thick elastic band i.e. it can venture a small distance away but it will ultimately get snapped back just when it looks capable of moving towards a fresh level of equilibrium. Sector rotation has dominated recent weeks and its bond yields which have played the tune for this dance, to MM they are now 50-50 hence we would not be surprised to see a correction in the recent buying of risk over defensives, if this does unfold we would advocate using the move to reducing further our exposure to the perceived safe havens like gold stocks and Utilities.
Over the weekend 3 pieces of news caught my attention with on balance the market influence net positive in our opinion:
1 – The Australian housing market continues to improve steadily, preliminary auction clearance rates came in ~81%, its second highest of 2019 – MM cannot see Australia avoiding a recession without a firm housing market so a clear definite positive.
2 – Alibaba (BABA US) “Singles Day” shopping spree looks to have set a record above $US31bn within just hours, an amazing number to comprehend and a clear sign that the Chinese consumer is alive and well for those with the correct offering, another positive for stocks.
3 – President Trump cannot go too long without wanting to imitate a full peacock display to regain the limelight, this time he said “China wants a trade deal far more than him” and he “hasn’t agreed to wind back tariffs” obviously negative commentary but the market dismissed it within an hour on Saturday, stocks remain clearly very optimistic that a trade deal will be finalised sooner rather than later.
MM remains comfortable with a neutral stance around current levels but our “Gut Feel” is slightly bullish.
On Saturday morning the SPI futures were pointing to the ASX200 opening up 27-points taking the index back towards the 6750 level as the stock / sector rotation looks set to continue - BHP closed down almost 1% in the US implying traders must be expecting some healthy broad based buying across much of our market to offset likely losses in the Energy Sector.
Thanks again for the questions, a clear concentration came in this week around the banks and Westpac (WBC) in particular which is not surprising considering the sector volatility after recent reports from 3 of the “Big 4 Banks”
ASX200 Index Chart
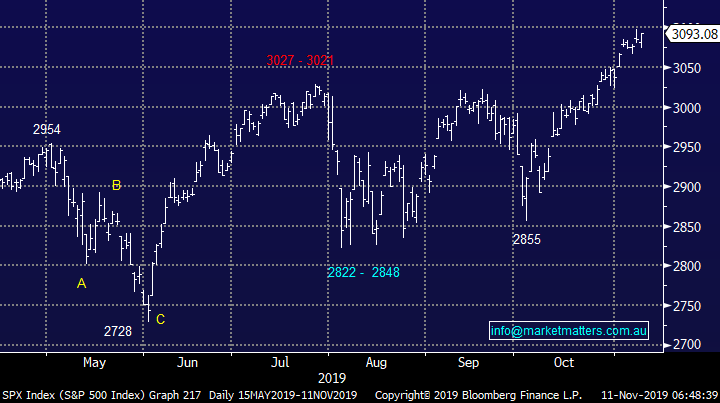
The US S&P500 index has been climbing a “wall of worry” of late, continually making fresh all-time highs but with a contradictory diminishing momentum. At this stage we would be buyers of the next 2% pullback, as we saw in early October there appears to be a wall of buying into periods of weakness but this strategy is slowly becoming more dangerous in our opinion.
MM needs the S&P500 to close under 3020 to switch to a negative stance towards US stocks.
US S&P500 Index Chart
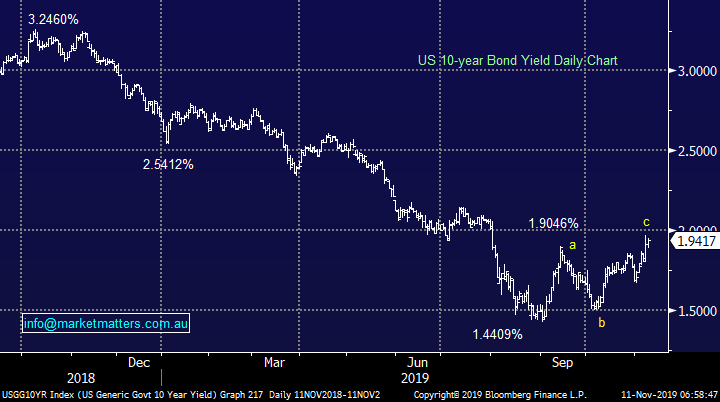
We mentioned earlier that MM is now 50-50 on bond yields, the chart below illustrates the current position of the very influential US 10-year bonds:
1 – Recently they have rallied up to test the 2% area, following the MM script nicely, if the push through 2% we will adopt a stance that US bond yields have bottomed i.e. bullish risk over defensives.
2 – A close back below 1.85% will trigger sell signals for MM targeting a test and probably break of 1.4%, this is very likely to produce a period of outperformance by defensives – a move MM will fade as we believe bond yields are “looking for a low”.
3 – If we see US bond yields make a fresh 2019 low the MM Global Macro ETF Portfolio is likely to take a position fading the move.
MM is neutral US bond yields here but with a clear plan of action around what comes next.
US 10-year Bond Yields Chart
Question 1
“Hello, why are you buying WBC before the announcement, knowing: 1. ANZ report was not great & 2. WBC report will be not so great either. The question how bad it’s going to be.” - Regards Alex L.
“Hi James and Crew, Regarding Westpac and your comments in this report below. Why are you not selling $30,000.00 worth of WBC now for approx. $2 more than the forthcoming SPP offer price. Or is there a good chance the SPP will be wound back and thus unable to get that volume back in at the discount?? I would appreciate your thoughts on this strategy,” - Cheers Richard T.
“Hi James, I noticed that you are referring the steep discount for the WBC cap raising. But $25.32 needs to compared to the Ex dividend price. Which is $1.14 gross . Essentially, WBC collected $2b in 3.5 mins with only ~2 discount. That's is only diluted the number of additional shares. We need to consider this as very bullish sign!” – regards Sam S.
Morning Guys,
I’m glad to be typing this today as opposed to the morning after the WBC report, to a certain degree our view on the stock is gaining some traction with others buyers into this weakness.
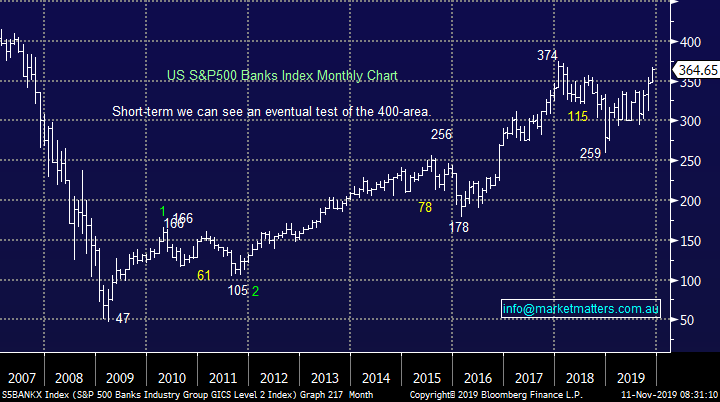
MM remains bullish the US and Australian Banking Sectors into Christmas and potentially early 2020, the chart below illustrates our Medium-term target for the US Banking Sector remains ~10% higher. Hence when we decided to sell our ANZ position after their poor report we allocated the monies straight into Westpac (WBC) and National Australia Bank (NAB), of course there was always the risk of poor numbers from either of the 2 however they had been sold off on the back of ANZ’s poor form so we believed a portion of any weakness was priced and hopefully any upside was not – second guessing results is fraught with danger.
MM is bullish the Australian & US Banking Sectors.
US S&P500 banking Index Chart
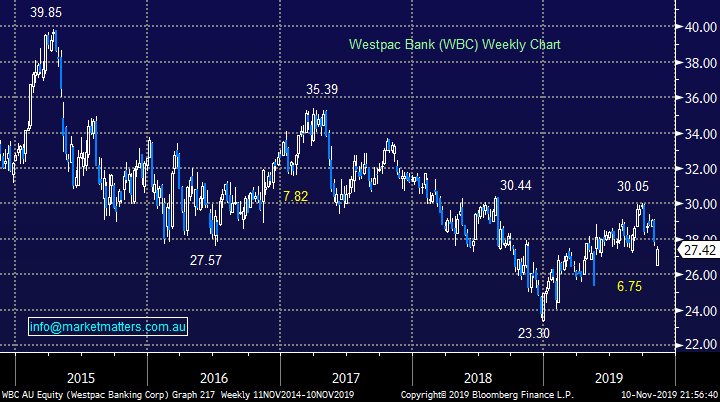
Over 600,000 retail investors have been offered the opportunity to participate in Westpac’s share purchase plan (SPP) in what is part of a $2.5bn capital raise to increase its regulatory capital – or in other words, make it safer i.e. unlike a lot of capital raises it’s not because the business has its back against the wall.
Demand was a very high in the Institutional raise to buy the first $2b, a bullish sign in our opinion. To keep things simple if the weight of money is keen to buy at $25.32 it looks a good deal – the deal opens tomorrow with a cut-off date of 12th December, investors have some time on their side. We believe a scale back is a possibility e.g. if 50% of the investors apply for $10k (not the $30k cap) then the demand becomes over $3bn but theoretically only $500m is available.
The stocks trading at $27.42 so buying at $25.32 ex-dividend is a good offer even if you can utilise the franking credits – Westpac yield at Fridays close is still 5.84% fully franked and over 9% grossed up = attractive to us.
We are bullish the banks hence MM will apply for the SPP stock and wait and see what we receive, its hard to know what that allocation will be however for our wholesale clients we received 35% of our bid amount in the institutional raise.
MM is comfortable with our current banking exposure.
Westpac (WBC) Chart
Question 2
“Hi James, I sent an email through last night but there was no reply today . I was after your opinion on Amazon, is it a buy, sell or hold. Am I doing something wrong with my requests which I send in on Sunday nights.” – David M.
Hi David,
Sorry, I missed it last Sunday night.
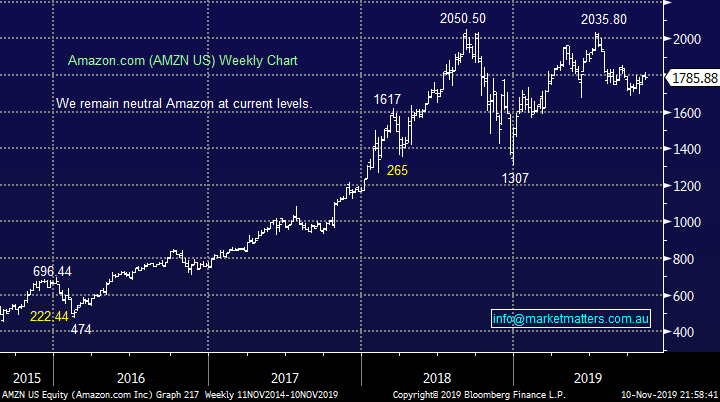
US goliath e-retailer Amazon (AMZN US), its trading at the same level as 16-months ago and we see no reason to try and second guess what comes next. The stocks not cheap which obviously brings with it downside risk but its clearly a successful / quality business with their web services kicking goals, it’s just too hard here from a risk / reward perspective.
MM is neutral Amazon (AMZN US).
Amazon (AMZN US) Chart
Question 3
“Hi, My first question relates to JHG, Janus Henderson. I note on the chart that it has recently jumped above the level of a head and shoulders pattern. I haven't noticed any commentary on this and note that you still have it shown as a hold. I don't yet own the stock and I'm wondering whether to buy some especially on a pullback. Next question relates to Costa Group, CGC, which I don't yet own. you show it as a buy and I'm considering buying up to 3%. any comment on this?” – Fred H.
Hi Fred,
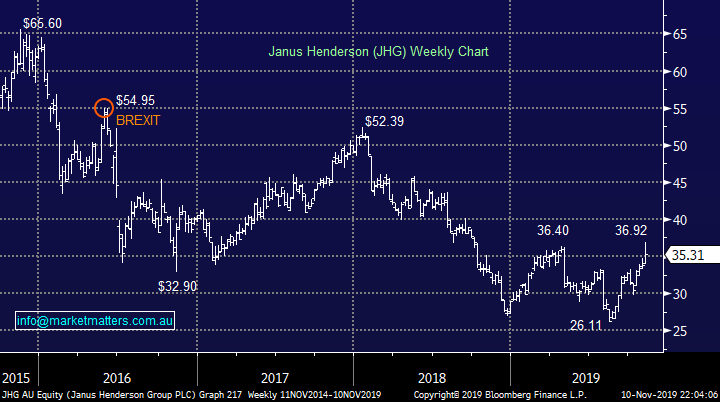
Janus Henderson (JHG) is definitely a topical stock on 2 fronts, which I’ll touch on below but MM went long for our International Portfolio on the 21st of October, which is performing nicely already up ~10%, the move clearly implies we are bullish the stock.
1 – JHG is vulnerable to adverse results from the UK election and / or BREXIT developments but we believe risk / reward is looking good for JHG – technically were bullish JHG while it holds above $33.
2 – We believe the embattled fund manger space is seeing glimmers of optimism after enduring a tough few years, we went long Pendal Group (PDL) last week, again a positive lead for JHG.
Janus Henderson (JHG) Chart
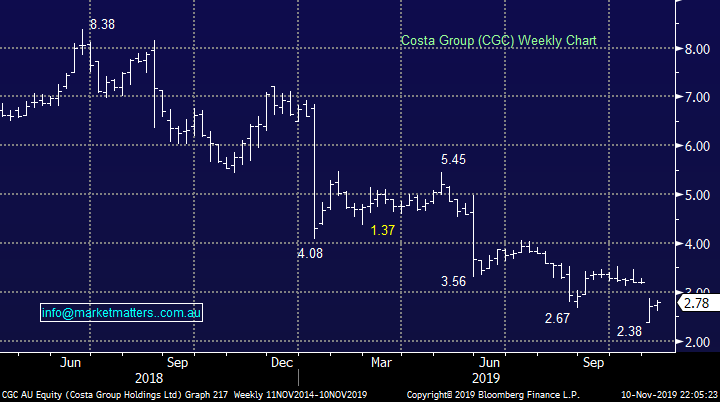
Costa Group (CGC) has been a thorn in our side as downgrades have arrived far too often for our liking by this berry and mushroom producer is looking attractive below $3 in our opinion – we recently reduced our holding from 7.2% to 5% from purely a portfolio management perspective, not because we want to sell CGC under $3.
MM is comfortable with our 5% exposure to CGC but this is clearly a high risk play.
Costa Group (CGC) Chart
Question 4
“What do you think of TGF as an energy play” – Mike C.
Hi Mike,
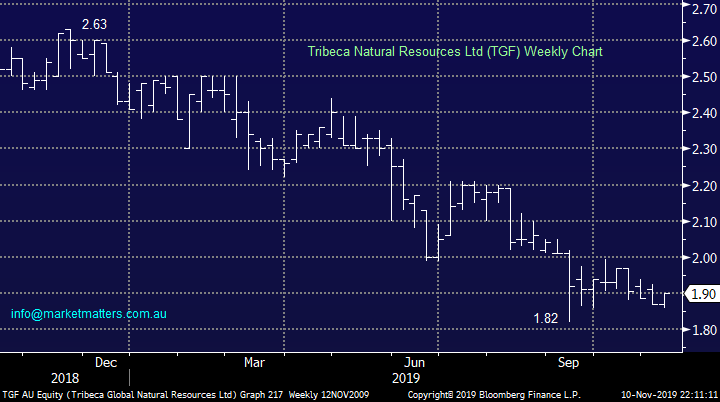
Tribeca Natural Resources Ltd (TGF) is a fund that invest in direct commodities, debt and equity, and their performance has clearly been weak. Shaw was involved in this listing and I had dinner with the guys who were running it. A smart team however I believe there has been some turnover of staff within Tribeca of late.
While we like the commodity space, and TGF now trades at a big discount to their assets, we want to see some performance from their fund first.
MM is neutral TGF.
Tribeca Natural Resources Ltd (TGF) Chart
Question 5
“Hi James and team, I wondering whether you can give your thoughts on CGF and HLS. I’m still holding them from earlier in the year.” Cheers Mike F
Hi Mike,
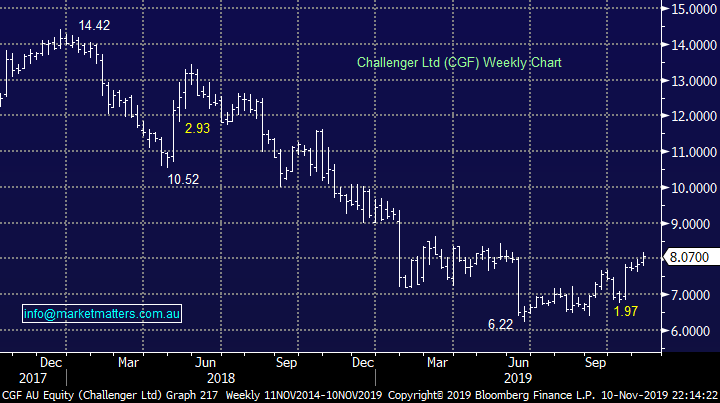
1 – Challenger (CGF) looks to have bottomed in 2019, a bit frustrating for MM was looking to buy the annuity business around $6, we were too fussy for our own good!
After breaking $8.00, CGF targets the $9 region, however we do not like the fundamentals of the business – margin contraction a real issue
Challenger Group (CGF) Chart
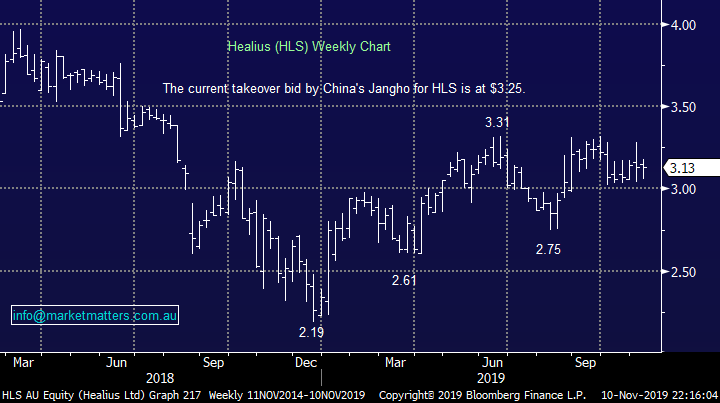
2 – Healius (HLS) continues to trade sideways between $3 and $3.30 with a similar rotational feel to the ASX200 index itself. Obviously HLS is in the takeover sights of Jangho but we don’t see this as a strong enough reason to buy back into the business.
MM is neutral HLS.
Healius (HLS) Chart
Question 6
“Hi - just looking for some advice on the best brokers to use for international trading. I am currently using CMC however this does not include all the markets covered by your international portfolio.” - Thanks Steve B.
Hi Steve,
The worlds equities market has become a very diverse group of opportunities, our own ASX200 is currently below its pre-GFC high but as can be seen below the Global World Index is more than +35% above the same milestone.
A few options here. Interactive Brokers have a huge range and are economical in terms of transaction costs, however client funds are held in Trust rather than a totally separated bank account like an Australian broker would do. The same is true for the stocks held, meaning that assets are not totally independent of the broker – it’s the same way CFD providers operate. Through Shaw and Partners we can trade in international stocks, although it’s more expensive and we have slightly less range, however assets are held in the name of the investor, not in trust. Brokerage starts at $US125 per trade. Email me if you’d like information on markets covered. [email protected]. We also operate managed accounts for international equities where a portfolio fee is charged and minimal brokerage (sophisticated investors only), however that is a portfolio we manage on behalf of the investor.
MSCI Global World Index (MXWO) Chart

Question 7
“G’Day again, I have been more or less trading a couple of stocks, mostly FMG and RIO and a few others. But I get a bit sick of getting a new set of paperwork each time I buy so could you tell me how many shares or what value of stock is the minimum I can hold? Last week I sold FMG but kept 250 shares. I am guessing perhaps a hundred would be enough. Is it different for each company? Thank you for any advice you have on this and for the continuous advice via the newsletters.” - Waz
Hi Waz,
Interesting question. While on the buy side, the smallest amount of shares that can be bought on market is $500 (known as a marketable parcel) on the sell side investors can sell all bar one share. I actually did this during the GFC when many companies were raising capital. As a shareholder of just 1 share, I was then entitled to participate in any Share Purchase Plan (SPP) that was offered. Westpac a good example here. Holders of just 1 share in WBC would be eligible to buy up to 30k worth of shares in the recent SPP at the $25.32 price tag. The companies hate this as the costs of administration around 1 share is high, while it also frustrated my accountant. A while ago I opted for a simpler existence with my portfolio so I no longer do this.
As an aside, if you have payment instructions lodged with your broker, they should update the registries automatically, there should not be a requirement to fill in all those forms.
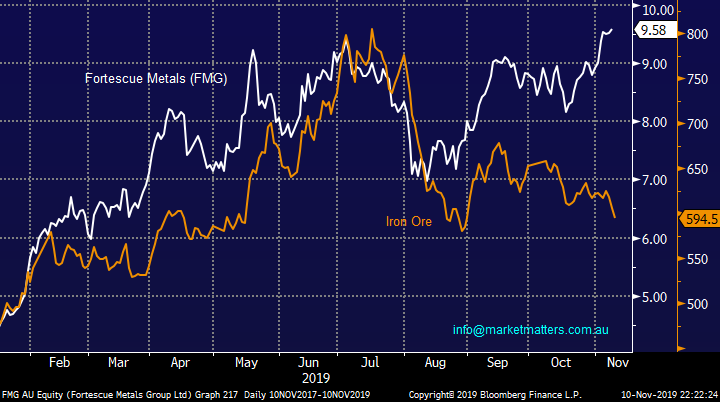
Just a note on Fortescue Metals (FMG) it’s usually very closely correlated to the iron ore price which is understandable but over the last 2-months this relationship has faded noticeably. We are happy to maintain our long exposure to FMG but are watching closely in case it starts to fall with the underlying bulk commodity price.
MM is bullish FMG with stops below $9.
Fortescue Metals (FMG) Chart
Likewise RIO Tinto (RIO) has been strong over recent weeks even while iron ore has struggled.
We remain bullish RIO while it holds above $93.70.
RIO Tinto (RIO) Chart

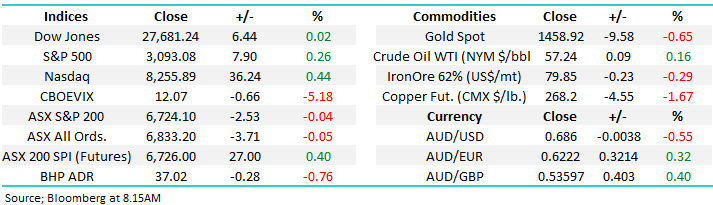
Overnight Market Matters Wrap
- Risk maintains to be on the table for investors across the globe, as it seems more apparent for the switch out of ‘safe haven’ assets such as gold and bonds into equities continue with the 3 key US indices hitting another all-time high last Friday.
- Despite the continuing US-China trade deal optimism, commodities were generally weaker. As mentioned above, gold was weaker and hit its lowest level in 3 months, while iron ore fell to US$79.85/t.
- BHP along with its peers are expected to underperform the broader market after ending its US session off an equivalent of 0.76% from Australia’s previous close, with ANZ and Macquarie Group (MQG) trading ex-dividend at $0.80 and $2.50 a share, respectively.
- The December SPI Futures is indicating the ASX 200 to open 18 points higher towards the 6745 level this morning.
Have a great day!
James & the Market Matters Team
Disclosure
Market Matters may hold stocks mentioned in this report. Subscribers can view a full list of holdings on the website by clicking here. Positions are updated each Friday, or after the session when positions are traded.
Disclaimer
All figures contained from sources believed to be accurate. All prices stated are based on the last close price at the time of writing unless otherwise noted. Market Matters does not make any representation of warranty as to the accuracy of the figures or prices and disclaims any liability resulting from any inaccuracy.
Reports and other documents published on this website and email (‘Reports’) are authored by Market Matters and the reports represent the views of Market Matters. The Market Matters Report is based on technical analysis of companies, commodities and the market in general. Technical analysis focuses on interpreting charts and other data to determine what the market sentiment about a particular financial product is, or will be. Unlike fundamental analysis, it does not involve a detailed review of the company’s financial position.
The Reports contain general, as opposed to personal, advice. That means they are prepared for multiple distributions without consideration of your investment objectives, financial situation and needs (‘Personal Circumstances’). Accordingly, any advice given is not a recommendation that a particular course of action is suitable for you and the advice is therefore not to be acted on as investment advice. You must assess whether or not any advice is appropriate for your Personal Circumstances before making any investment decisions. You can either make this assessment yourself, or if you require a personal recommendation, you can seek the assistance of a financial advisor. Market Matters or its author(s) accepts no responsibility for any losses or damages resulting from decisions made from or because of information within this publication. Investing and trading in financial products are always risky, so you should do your own research before buying or selling a financial product.
The Reports are published by Market Matters in good faith based on the facts known to it at the time of their preparation and do not purport to contain all relevant information with respect to the financial products to which they relate. Although the Reports are based on information obtained from sources believed to be reliable, Market Matters does not make any representation or warranty that they are accurate, complete or up to date and Market Matters accepts no obligation to correct or update the information or opinions in the Reports. Market Matters may publish content sourced from external content providers.
If you rely on a Report, you do so at your own risk. Past performance is not an indication of future performance. Any projections are estimates only and may not be realised in the future. Except to the extent that liability under any law cannot be excluded, Market Matters disclaims liability for all loss or damage arising as a result of any opinion, advice, recommendation, representation or information expressly or impliedly published in or in relation to this report notwithstanding any error or omission including negligence.


