The awful Australian drought & its ramifications (AAC, ELD, RRF, NUF, GNC, RIO)
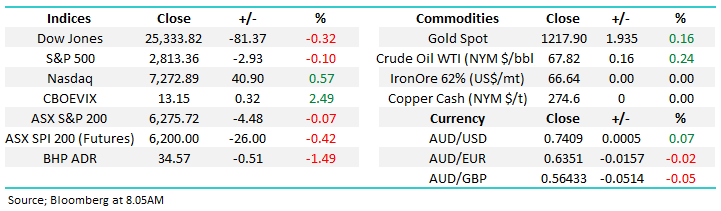
The ASX200 had another quiet day on the index level while being volatile under the hood as reporting season produces more curve balls, pretty standard for this time of year. On a sector level the banks and financials appear to have lost their recent lustre while the large cap resources helped the bulls.
However, after-market RIO’s report disappointed investors leading to a -3.4% drop by the stock in London while BHP has closed down -1.4% in the US, hence it feels like we are set for yet more sector rotation this morning. We have interest in RIO around $74, over 9% below yesterdays close, and have expanded on our thoughts at the end of this report.
- We remain mildly short-term bullish the ASX200 while the index holds above 6250, neutral between 6250 & 6140 and bearish on a break of 6140.
Overseas stocks were overall weak with the UK FTSE the worst of the bunch falling -1.5% while the US NASDAQ was firm closing up 0.6% courtesy of an impressive 6% surge by APPLE after its strong market update.
The most eye-catching move to MM over night was the 3.2% plunge in copper which is likely to end the recent recovery by the likes of Oz Minerals (OZL). Today’s report was initially going to focus on the Australian farming sector but we quickly realised it’s way too large a topic for one report hence this morning we’ve focused on 5 stocks who are impacted by the current severe drought.
I was actually having breakfast this morning with a business group that I’m involved with and one the members is in a water tank business. They’ve enjoyed a good run in the last few years with strong periods of growth but the lack of rain currently is having a big negative influence on sales which plays into whether or not they make investments in new plant and equipment. Weather is clearly a big variable for many parts of the Australian economy.
We have very mixed feelings about even considering the risks / opportunities being created by todays relentless drought but a number of subscribers have asked for our views and obviously it is a very topical subject.
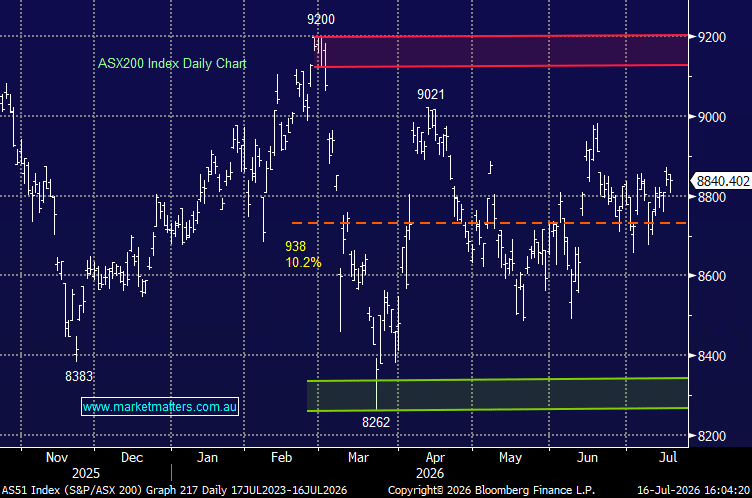
ASX200 Chart

The drought that’s ravaging our local farmers has been described my many as the worse in living memory and it can be put into perspective with some simple and extremely painful statistics:
1. Much of Australia has received its lowest rainfall in over 25-years.
2. Parts of our country have experienced the 2nd warmest summer on record.
3. Over 80% of NSW is already in drought – we’ve even noticed the lack of rain in Sydney.
Takeover bids for GrainCorp Limited (GNC) and Goodman Fielder (GFF) illustrates the long-term strength of the Australian agricultural sector, however the volatile weather / commodity price trends have impacted the sector severely leading to average performance over the last few years.
· At MM we like Australia’s position as the “bread basket” for Asia – clearly a long-term view.
Today we’ve focused on 5 stocks that are certainly suffering as the lack of rain bites.
1 Australian Agricultural Company (AAC) $1.24
Australian Agricultural Company (AAC) is the country’s largest producer of beef and live cattle for export and is also a major landholder and producer of feed grain, wheat, sorghum, and cotton. The company currently has a market cap of $750m as is not currently paying a dividend.
Recently the company reported operating EBITDA* of $14m while maintaining its balance sheet is robust with net debt of $348m. The CEO has said conditions remain challenging moving forward on more than just the weather level, hence leaving us uninspired at present.
*EBITDA = earnings before interest tax depreciation & amortisation
Looking at a simple chart of annual revenue over the past 10 years tells the volatile story of AAC i.e when times are good their great, but when they’re bad there is little reason to own it.
AAC Annual Revenue
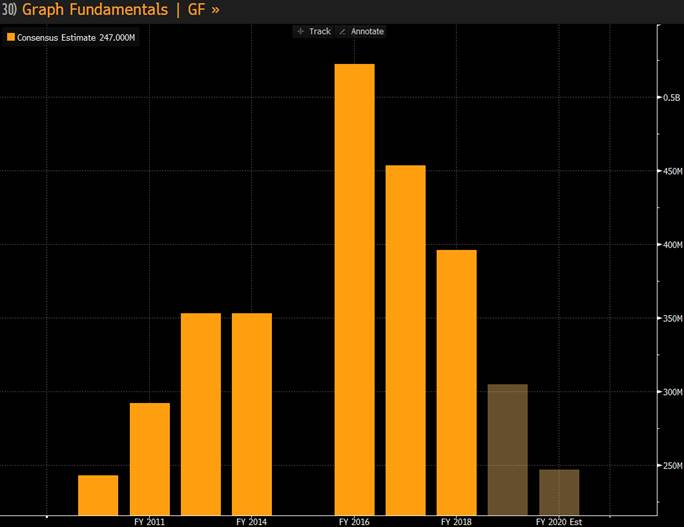
· MM is neutral AAC seeing better opportunity elsewhere.
Australian Agricultural Company (AAC) Chart

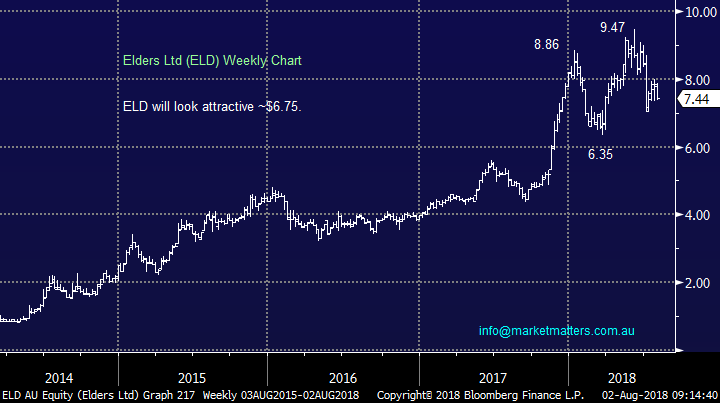
2 Elders (ELD) $7.44
Agribusiness ELD plunged ~15% in July when it updated the market including the negative impact of the dry conditions on demand for chemicals and cattle prices. However, EBITDA for 2018 is still expected to be in the same range as 2017.
While Elders is not the company it once was it still has a market cap of $862m and is trading on an est. 2018 P/E of 14.3x while yielding an ok fully franked dividend.
· MM likes ELD into weakness around $6.80.
Elders (ELD) Chart
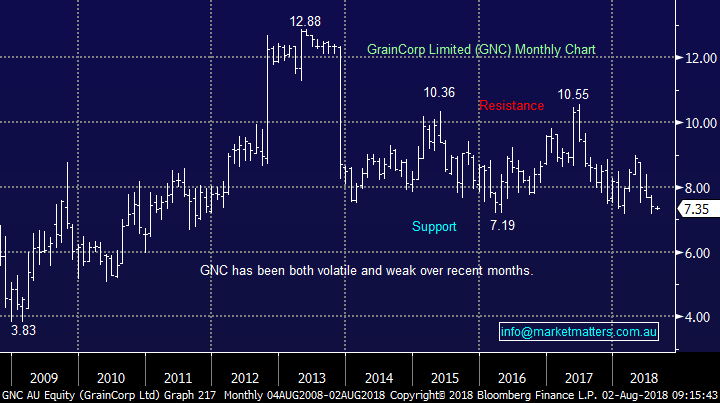
3 GrainCorp (GNC) $7.35
Grains storage and transport business GNC has traded sideways, to down, since the regulator blocked its takeover back in 2012/3 showing the markets differing opinions on the company.
In May they reported a significant +60% contraction in earnings as ongoing weather problems hindered crop production, they also cut their dividend from 15c to 8c putting the stock on an unstable yield of ~2% fully franked. We see better value elsewhere when searching the depressed agribusiness landscape and at this stage would be looking at sub $6 in the shares before becoming interested.
· MM is neutral GNC seeing better opportunity elsewhere.
GrainCorp (GNC) Chart
4 Nufarm (NUF) $7.25
Nufarm Limited (NUF) produces products that protect crops from pests, weeds, and disease, while also treating seeds and making seed protection products. Growth in crop production to feed both people and animals should benefit Nufarm substantially i.e. the improved diet of China / Asia.
The stock fell ~8% last month after the agrichemical business flagged a downgrade to earnings on the back of the dry weather conditions. In essence, fewer crops means less crop protection, however farmers often buy ahead so this product will sit in sheds for the next season, therefore the impact on NUF may not be as short lived as flagged by the company.
However, the weather like economics is a cyclical phenomenon that eventually turns but just like with stock markets its extremely hard to pick exactly when, hence we like the simple concept of accumulating into weakness:
· MM likes NUF at $7.15 and $6.50 as accumulation areas.
NB We could also have included Incited Pivot (IPL) in this section but we currently prefer NUF.
Nufarm (NUF) Chart

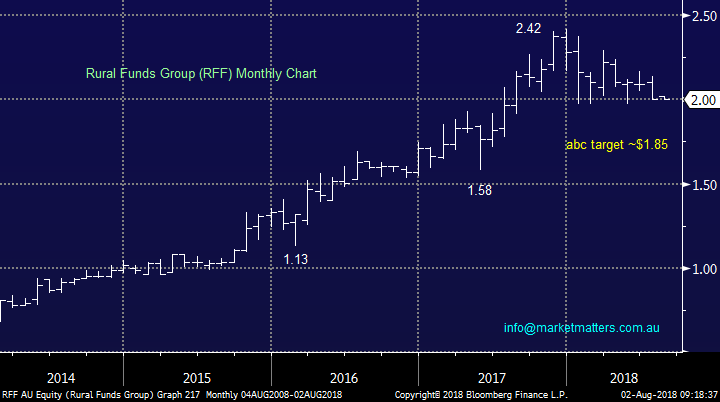
5 Rural Funds Group (RFF) $2
Lastly moving onto RFF, a real estate property trust which owns agricultural assets, potentially an ideal time for them to be on the accusation trial e.g. recently they purchased a 7,600-hectare cattle property in Queensland.
The stock is not cheap at present compared to its current assets but another 5-10% lower and we believe value will emerge.
· MM likes RFF under $1.90, especially for the Income Portfolio as the yield will be over 5%.
Rural Funds Group (RFF) Chart
Conclusion (s)
Today’s subject is not a happy one but we can see a few excellent opportunities into further weakness within the agribusiness sector:
1. MM likes ELD around $6.80.
2. MM likes NUF at $7.15 and $6.50 as accumulation levels for NUF.
3. MM likes RFF around $1.85.
Rio ; A bit of a mood killer
Rio Tinto (RIO) reported 1H 2018 results after market with a number of clear takeaways. This was a weaker than expected result pretty much across the board from an 8% miss on the top line down to a 4% miss at the EBITDA level and a lower than expected dividend.
While the result was a solid uplift year-on-year, the momentum on the half was clearly an issue, particularly in iron ore which has weighed on the overall numbers. 6 from the last 8 interim reports from RIO have surprised on the upside leading mostly to positive moves in the stock price.
Wednesday evening’s result should lead to weakness, particularly given recent share price strength plus some divergence from underlying commodity prices. Importantly, recent trends have shown that selling persists following a disappointment like this, so it could take some time before Rio retests its recent highs.
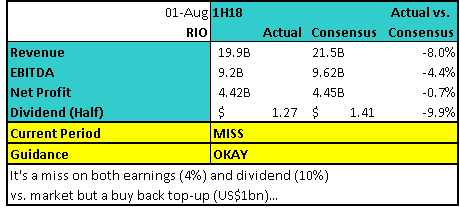
Where was the BIG capital management initiative? There are some offsets in the result that are positive and these mostly come around capital management initiatives with an additional share buy-back of $1.0B, to be undertaken on the London listed shares. Importantly, this is on top of their current buy-back programme with about $1.4billion of that one remaining i.e there is now a big $2.4bn buy back in place, however given the level of asset sales they have had – about $8.5bn in the past year, there is clearly more room to move, and the market was looking for some more clarity around when and how that might happen.
The balance sheet for RIO is in tip-top shape, with gearing languishing at just 10%. They have clearly outlined plans for CAPEX which was below market expectations, and they’re flush with franking credits which may lose appeal if Shorten gets the top job at some stage next year.
They announced an expansion of an existing program but nothing earth shattering as the market had hoped. It will happen, and it will be supportive of the share price when it does. The question now is, from what level will the shares be supported?
Is it still a buy? Taking a step back and thinking about the results with a wider lens, they did confirm the upward trend the company has followed since early 2016, with profit growth at ~12% on the year, dividend growth of ~15% on the year while debt remains low.This is a good story and the journey is not yet over, however the market has simply gotten ahead of itself. Shaw’s very well regarded Mining Analyst Peter O’Connor has RIO in his buy bucket, and I think that’s the right call on a 12 month view, however buying higher lows rather than new highs is the way to play this (and other commodities at this point in the cycle).
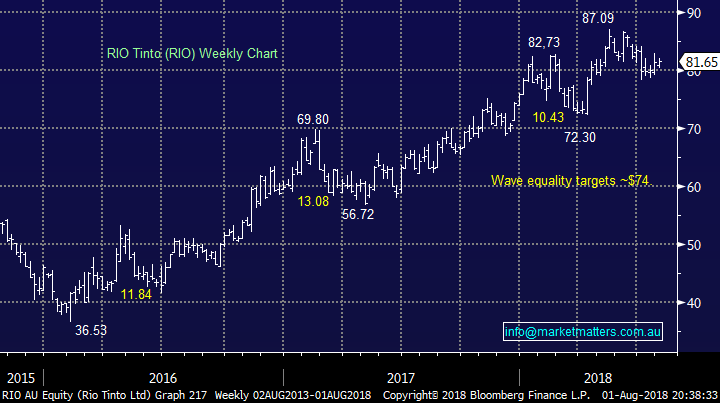
Rio Tinto (RIO) Chart – targets $74 on the downside
But remember…At some point inflation will rear its head if global growth continues at its current clip, wages will rise and central banks will be forced to jack up interest rates further, an environment where commodities and the companies that mine them do well.
While it’s hard to sugar coat a soft result, Rio is a stock to buy into weakness, with our technical target sitting at $74.00, or ~9% lower.
Global markets
The US market held reasonably firm last night with heavyweight APPLE carrying the load closing up 6%.
US S&P500 Chart

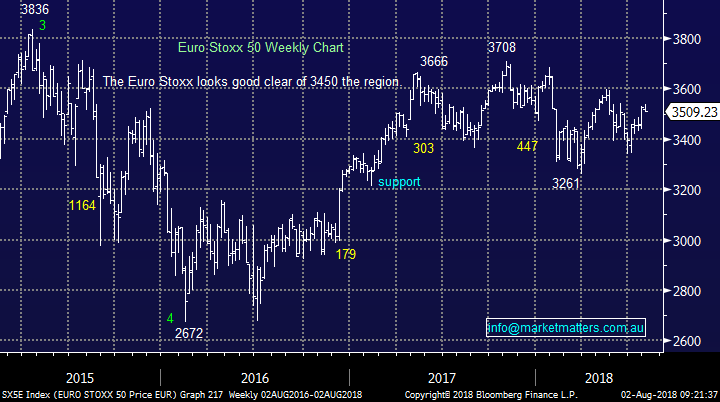
European stocks drifted lower except for the UK FTSE which tumbled -1.2% - we remain bullish Europe and bearish the FTSE, a rare mix.
Euro Stoxx 50 Chart
Market Matters overnight wrap
- Apple came within a whisker of becoming Wall St’s first US$1 trillion company after rallying nearly 6% overnight to a record high of US$201.50/share, following better than expected earnings. The stock, which reached a market cap of US$990bn, helped the tech sector recover from recent weakness and the Nasdaq rally back above 7700.
- The broader US markets were however slightly weaker, with the Dow losing 0.3% and the S&P 500 -0.1% lower as trade war fears clouded the continuing strong quarterly earnings season and stronger than forecast July employment numbers of 219,000.
- Commodities also suffered, following yesterday’s slightly lower than expected Caixin PMI data, as well as the rising US-China trade fears as President Trump threatened to raise tariff levels further from 10% to 25% on up to US$200bn worth of imports. Iron ore and oil prices fell around 2.4% while copper (-2%) led the base metals lower.
- Rio, which weakened 3% in US trading, was also affected by a half year earnings result - reported after market close in Australia - which was slightly below expectations. BHP down 2% overnight while the A$ is slightly lower at around US74c.
Have a great night
James / Harry & the Market Matters Team
Disclosure
Market Matters may hold stocks mentioned in this report. Subscribers can view a full list of holdings on the website by clicking here. Positions are updated each Friday, or after the session when positions are traded.
Disclaimer
All figures contained from sources believed to be accurate. Market Matters does not make any representation of warranty as to the accuracy of the figures and disclaims any liability resulting from any inaccuracy. Prices as at 02/08/2018
Reports and other documents published on this website and email (‘Reports’) are authored by Market Matters and the reports represent the views of Market Matters. The MarketMatters Report is based on technical analysis of companies, commodities and the market in general. Technical analysis focuses on interpreting charts and other data to determine what the market sentiment about a particular financial product is, or will be. Unlike fundamental analysis, it does not involve a detailed review of the company’s financial position.
The Reports contain general, as opposed to personal, advice. That means they are prepared for multiple distributions without consideration of your investment objectives, financial situation and needs (‘Personal Circumstances’). Accordingly, any advice given is not a recommendation that a particular course of action is suitable for you and the advice is therefore not to be acted on as investment advice. You must assess whether or not any advice is appropriate for your Personal Circumstances before making any investment decisions. You can either make this assessment yourself, or if you require a personal recommendation, you can seek the assistance of a financial advisor. Market Matters or its author(s) accepts no responsibility for any losses or damages resulting from decisions made from or because of information within this publication. Investing and trading in financial products are always risky, so you should do your own research before buying or selling a financial product.
The Reports are published by Market Matters in good faith based on the facts known to it at the time of their preparation and do not purport to contain all relevant information with respect to the financial products to which they relate. Although the Reports are based on information obtained from sources believed to be reliable, Market Matters does not make any representation or warranty that they are accurate, complete or up to date and Market Matters accepts no obligation to correct or update the information or opinions in the Reports. Market Matters may publish content sourced from external content providers.
If you rely on a Report, you do so at your own risk. Past performance is not an indication of future performance. Any projections are estimates only and may not be realised in the future. Except to the extent that liability under any law cannot be excluded, Market Matters disclaims liability for all loss or damage arising as a result of any opinion, advice, recommendation, representation or information expressly or impliedly published in or in relation to this report notwithstanding any error or omission including negligence.
To unsubscribe. Click Here