The RBA wants infrastructure spending, can we still find opportunities here? (EEM US, MSCI, BLD, ABC, CIM, DOW, LLC)
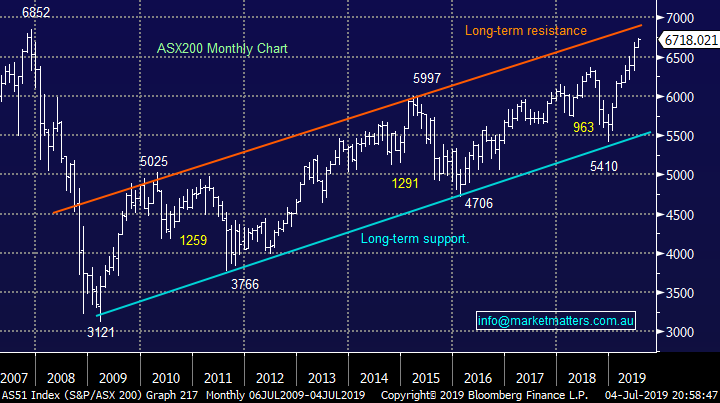
The ASX200 has continued its quest to scale new all-time highs closing less than 2% below the historic milestone set in November 2007, just before the infamous GFC. To-date the local market has rallied strongly printing both higher monthly highs & lows since its panic 5410 bottom less than 7-months ago, Australian stocks have now advanced an impressive 24% in a basic straight line. The tide turned for equities in dramatic fashion when markets realised they had totally misread central banks, and especially the US Fed in late 2018; in December markets were adopting a hawkish stance looking for rate hikes before Central Banks turned that view on its head, guiding to rate cuts rather than hikes and lower rates for longer.
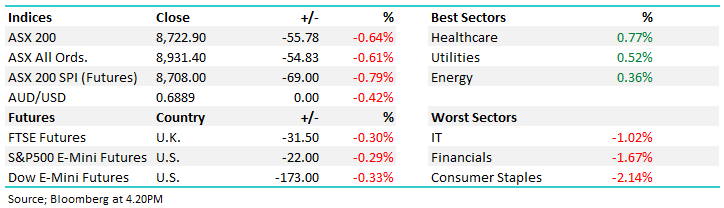
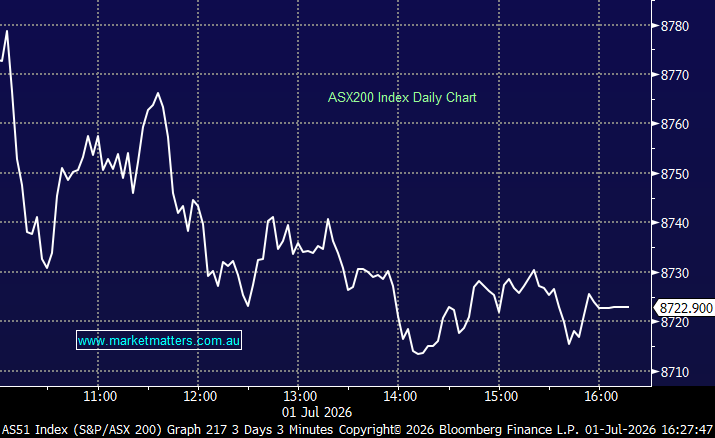
Under the hood yesterday it was again the high yielding sectors that propelled the market to make fresh 11 ½ year highs with the Banks, Real Estate, Transport and Utilities all enjoying strong gains. The simple numerical picture showed the winners more than doubled losers on another session of fairly low volume - but as I keep typing “no meaningful selling” was around. The market still feels a little underweight stocks although investors looking to buy shouldn’t despair too much, even while the ASX200 has been surging higher it still has experienced 3 short-term pullbacks of between 170 & 200-points.
Clearly anybody that tries to tell you that interest rates don’t impact share prices have been hibernating for the last decade, for subscribers who have missed the point in the last few reports its all about relative returns:
1 – A 5 year term deposit with CBA for $100k is now paying 1.8% pa (2% for 5 months is their best rate) or $1800 per year/ $150 per month
2 – The same $100k invested in CBA shares at todays prices is expected to yield 4.90% pa plus franking = 7% or $7000 per year / $583 per month
The interest rate differential adds a lot of “fat” to the equation for investors nervous around potential capital losses with CBA shares. Hence while we have adopted a more cautious approach to stocks over recent weeks MM is keeping an eye on yield within the structure of our 2 local portfolios.
MM remains comfortable to adopt a more conservative stance over the next 6-months.
Overnight US stocks were closed for Independence Day, Europe was basically unchanged and the SPI futures are pointing to a very quiet Friday for local stocks.
Today we are going to cast our eyes over the Australian infrastructure space after RBA head Philip Lowe called on the government for greater spending in this area to boast economic growth.
ASX200 Chart
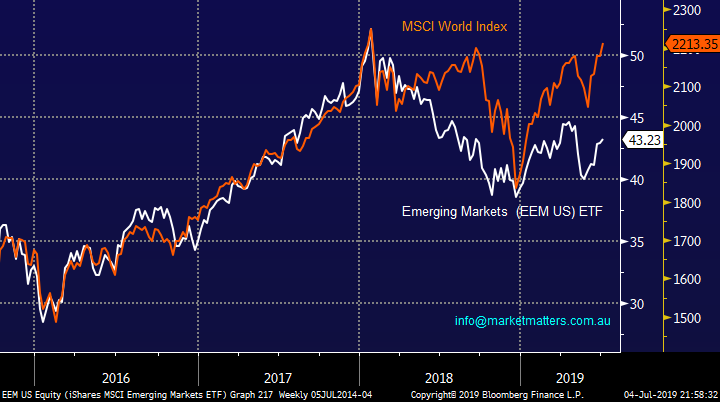
Interestingly the Emerging Markets (EEM) have not embraced recent global strength by equities significantly underperforming since early 2018. We acknowledge the negative impact on EEM of a strong $US but the $US Index is only up ~8% over the same period which feels relatively minor in the scheme of things.
All else being equal, a weaker dollar is generally favourable for emerging market assets because it makes it easier to service dollar-denominated debt, which combined with the fresh dovish stance by the Fed should theoretically have had a major positive impact on EEM - but it’s been fairly muted in our opinion. The crux of the issue appears to be US – China trade and although things have improved on the surface EEM is telling us it’s a long journey ahead + Trump is looking to come out on top here, at least on the surface.
MM is watching Emerging markets for some performance catch up but no signs are unfolding at present.
Emerging Markets (EEM US) ETF v MSCI World Index Chart
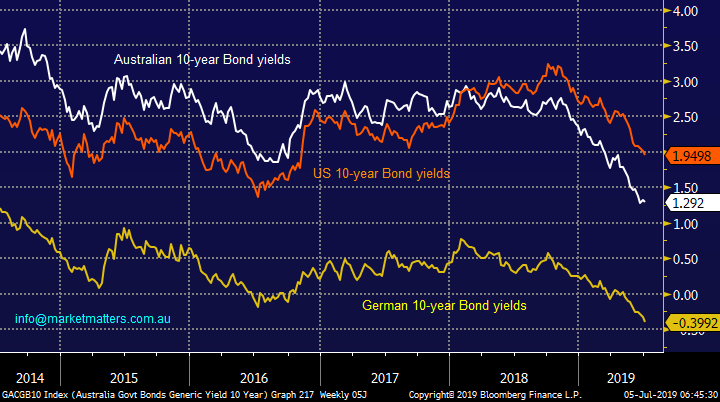
European interest rates continue to shout from the hilltops that Australian investors should remain very open-minded on interest rates, while our own 10-year bonds are currently yielding 1.29% the following European equivalents are all negative Germany -0.4%, France -0.13%, Netherland -0.25% and Switzerland -0.66% while to add fuel to our point Japan’s are also negative at -01.6%.
MM will remain net bullish, if not cautious, stocks until bond yields turn higher.
Australian, German & US 10-year bond yields Chart
The Australian Infrastructure Sector
Infrastructure spending helps improve growth and jobs in the short term as the projects unfold plus also lifting productivity over the medium to longer term. With the RBA cash rate at only 1% and our 10-year bonds trading under 1.3% its easy to comprehend why Mr Lowe believes “there must be projects out there with a risk-adjusted return of more than 2 per cent".
Arguably the most important point is the RBA has very little room to cut interest rates any further as they will be at zero before we know it hence any alternative form of economic stimulus would make the economists in Martin Place feel much happier.
Australian RBA targeted Cash Rate Chart

Today we have looked at 5 stocks who are well positioned to benefit from ongoing increased infrastructure spending. I have focused more on the initial spending benefits like builders who compete for contracts and could be limited in the number of projects they can handle, as opposed suppliers who are limited only by production capacity and whose revenue is further down the path. Also of course we have stocks whose materials are used in construction, large government spending should create a nice tailwind for the businesses.
1 Boral (BLD) $5.37
Manufacturer and supplier of building /construction materials Boral has endured a very tough 18-months with its shares falling almost 40%, an extremely poor return in a booming market as they grappled with a big US acquisition which the market feels they paid too much for.
Locally, the residential slowdown appears to have overridden any benefits from commercial, infrastructure and major projects. Also rival CSR reported at the end of June that volumes in April and May had remained flat even following the industry tailwinds from the Federal election win by the Liberals.
Importantly MM is bullish the $A over the next 12-18 months with recent comments by President Trump stating in no uncertain terms he wants a weaker $US, not good news for BLD who receive a significant portion of their revenue in $US. BLD’s shares are currently conservatively priced trading on an Est P/E of 13.7x for 2019 while yielding ~5% part franked.
BLD should be well positioned as a beneficiary of an Australian infrastructure boom which should be spurred by both election promises and sheer need as pointed out by the RBA, the question is how much is already built into the stock price.
MM currently prefers CSR, a stock we already hold in our Income Portfolio to BLD.
Boral (BLD) Chart

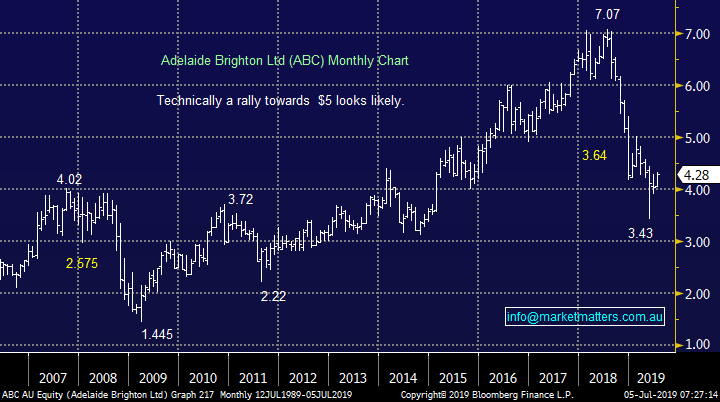
2 Adelaide Brighton (ABC) $4.28.
ABC is Australia’s largest cement maker and is therefore well placed to ride any boom in infrastructure spending, although as is often the case, strong rhetoric / a good story has not translated to positive SP performance in recent times with the stock having a horror 18-months tumbling ~40%. ABC has just over 30% of its exposure to residential and infrastructure respectively with the remaining 40% made up by commercial and mining projects.
The company released another disappointing market update in May when it announced they expected net profit after tax to be down 10-15% from last years $190m, again a weak residential market received some of the blame along with increased competition. The CEO’s statement smelt of potential takeover, rarely good news for the aggressors shares - “While market conditions are expected to impact current year earnings, our balance sheet is strong and provides us with flexibility to pursue new opportunities that arise in challenging market conditions. We will continue to focus on operational improvement and cost efficiency to mitigate the impact on earnings.”
The stocks not particularly cheap trading on an Est P/E of 16.9x for 2019 but they do yield well over 5% fully franked. Technically MM likes ABC for an initial 15-20% recovery.
MM likes ABC as an aggressive play on infrastructure.
Adelaide Brighton (ABC) Chart
3 CIMIC (CIM) $46.04.
CIM is an engineering-led construction, mining, services, and public private partnerships company whose shares were recently targeted by an overseas short seller. Hong Kong-based research firm GMT Research analysts claim that CIMIC “inflated profits by around 100% in the last two years through aggressive revenue recognition, acquisition accounting and avoidance of JV losses.” Basically what they are saying is CIM’s profits are an illusion!
This week CIM announced that its subsidiary UGL had secured a 5-year extension to its contract with Sydney Trains for the delivery of maintenance and logistics services for a portion of Sydney’s metropolitan passenger rail fleet – the deal amounts to $630m for UGL.
Technically CIM is neutral / positive but has failed 3 times above $50, perhaps next time will be 4th time lucky!
On balance MM is neutral CIM.
CIMIC (CIM) Chart

4 Downer (DOW) $7.17.
Engineering and infrastructure management services business DOW was downgraded by Credit Suisse in late May plus they then shocked the market with the warning that its joint engineering partner (Senvion) for the Murra Murra wind farm project had filed “self-administration” (i.e. bankruptcy) in Germany. DOW subsequently warned that this could have meaningful financial impact on its own business and the project especially because: “Downer holds a substantial bank guarantee from Senvion”.
Technically Dow is slightly bearish with a potential target ~$6 and it’s unlikely that its sub 4% part franked yield is going to attract current monies searching for income. A resolution / clarity around Senvion will be the main driver from here.
MM has no interest in DOW.
Downer (DOW) Chart

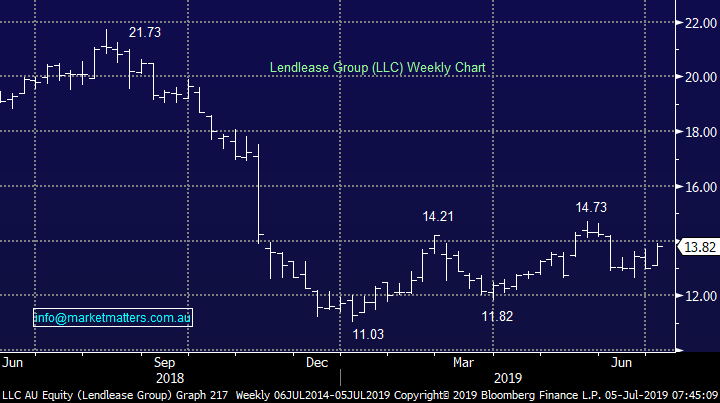
5 Lend Lease (LLC) $13.82.
LLC has been a serial underperformer since mid-2018 which saw its shares almost halve in rapid time. International property and infrastructure was rumoured to be in the takeover sights of a major Japanese company, suspected to be Mitsui, but the share price doesn’t appear to be taking the comments particularly seriously. The Japanese company was rumoured to be interested in acquiring the company and then breaking it up and offloading different parts to other suitors.
The business does appear to have cleared the decks back in February when it announced H1 revenue of $7.68 billion, down 11% on the same period in the previous year, with profit falling 96.3% to just $15.7 million.
Technically LLC looks ok / neutral while it can hold above $13.
MM is neutral LLC.
Lend Lease (LLC) Chart
Conclusion (s)
Of the 5 stocks looked at today Adelaide Brighton (ABC) is the one where MM currently sees the most opportunity especially as investors search for secondary areas of yield with the stock market.
Global Indices
No change as closed overnight – previously the major US indices all made fresh all-time highs last night, a move we have been anticipating for most of 2019 – we are now more cautious moving forward, at least until equities show their hand at current levels.
We reiterate that while US stocks have reached our target area they have not generated any sell signals.
US NASDAQ Index Chart

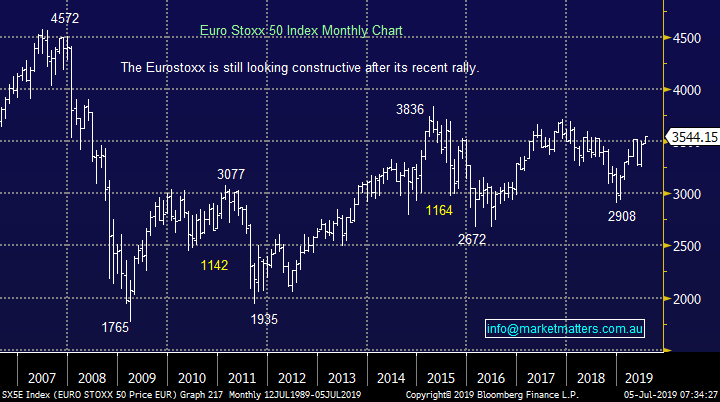
No change again with European indices, we remain cautious European stocks but the tone has improved recently and ongoing fresh highs in 2019 remain strong possibility.
EuroStoxx Chart
Overnight Market Matters Wrap
· US markets were closed for the Independence Day holiday overnight, while European markets traded at their highest level in over a year to a sixth straight gain as hopes remain that Christine Lagarde will continue the ECB’s dovish stance.
· Markets are wondering how the US economy is faring amid slowing global growth and US-China trade tensions. The jobs report released tonight will be closely watched by all, with implications for the Fed. A weak print will see a cut to rates as early as this month.
· Australian income tax cuts were passed last night which, along with interest rate cuts, should give a boost to the consumer. With signs of life in the housing market, retailers are set to enjoy some tailwinds for the first time in years.
· Aluminium rose 1% on the LME while iron ore fell 2.2%. Crude oil fell 0.94%, while Gold is trading at $US1416/oz.
· The September SPI Futures is indicating the ASX 200 to open marginally higher, testing the 6725 in an expected quiet session.
Have a great day!
James & the Market Matters Team
Disclosure
Market Matters may hold stocks mentioned in this report. Subscribers can view a full list of holdings on the website by clicking here. Positions are updated each Friday, or after the session when positions are traded.
Disclaimer
All figures contained from sources believed to be accurate. Market Matters does not make any representation of warranty as to the accuracy of the figures and disclaims any liability resulting from any inaccuracy. Prices as at 05/07/2019
Reports and other documents published on this website and email (‘Reports’) are authored by Market Matters and the reports represent the views of Market Matters. The MarketMatters Report is based on technical analysis of companies, commodities and the market in general. Technical analysis focuses on interpreting charts and other data to determine what the market sentiment about a particular financial product is, or will be. Unlike fundamental analysis, it does not involve a detailed review of the company’s financial position.
The Reports contain general, as opposed to personal, advice. That means they are prepared for multiple distributions without consideration of your investment objectives, financial situation and needs (‘Personal Circumstances’). Accordingly, any advice given is not a recommendation that a particular course of action is suitable for you and the advice is therefore not to be acted on as investment advice. You must assess whether or not any advice is appropriate for your Personal Circumstances before making any investment decisions. You can either make this assessment yourself, or if you require a personal recommendation, you can seek the assistance of a financial advisor. Market Matters or its author(s) accepts no responsibility for any losses or damages resulting from decisions made from or because of information within this publication. Investing and trading in financial products are always risky, so you should do your own research before buying or selling a financial product.
The Reports are published by Market Matters in good faith based on the facts known to it at the time of their preparation and do not purport to contain all relevant information with respect to the financial products to which they relate. Although the Reports are based on information obtained from sources believed to be reliable, Market Matters does not make any representation or warranty that they are accurate, complete or up to date and Market Matters accepts no obligation to correct or update the information or opinions in the Reports. Market Matters may publish content sourced from external content providers.
If you rely on a Report, you do so at your own risk. Past performance is not an indication of future performance. Any projections are estimates only and may not be realised in the future. Except to the extent that liability under any law cannot be excluded, Market Matters disclaims liability for all loss or damage arising as a result of any opinion, advice, recommendation, representation or information expressly or impliedly published in or in relation to this report notwithstanding any error or omission including negligence.