Time to start considering EOFY, fund managers are! (DMP, AMP, PPT, TLS, AZJ, GNC, QBE, AGL)
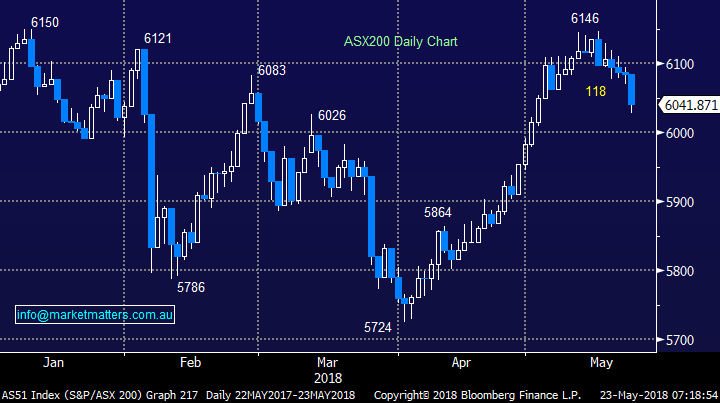
The ASX200 had a pretty poor day falling -0.7% with selling across most sectors throughout the whole session – the opinion from most other trading desks was it felt like a classic offshore sell order – although the cynic in me thinks that’s the typical excuse when no one has an answer! Interestingly in the midst of a sea of red Commonwealth Bank (CBA) finally attracted some decent buying interest when it tested its 2016 lows, below the psychological $70 area, and actually managed to buck the trend and close up +0.2%.
Overnight the US gave back a decent chunk of Mondays large gains but the SPI futures are implying the ASX200 will only open a few points lower, as we continue to feel one step ahead of the US while following Europe closely which mostly closed up last night.
- Medium term MM remains bullish targeting 6250 but the risk / reward is no longer compelling for the buyers - we remain in “sell mode”.
Today’s report is going to look at some of the markets worst performers as we consider likely candidates for tax loss selling and just general housekeeping / portfolio clean ups.
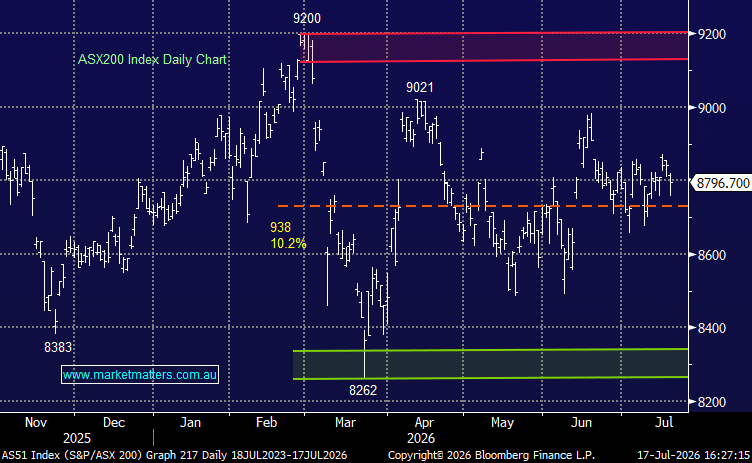
ASX200 Chart
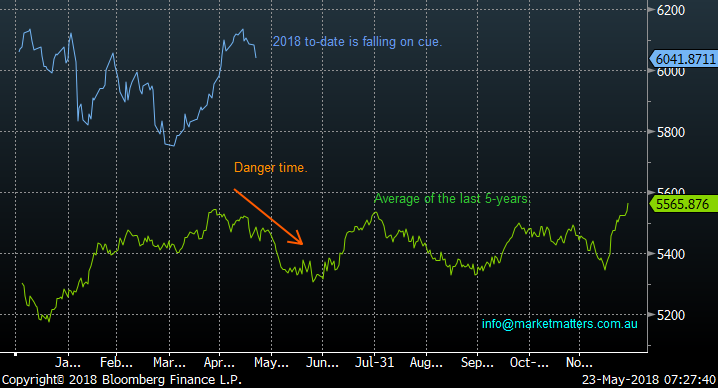
I’ve heard a number of “sell in May and go away” comments earlier this week and the below seasonality chart clearly illustrates why. The pullbacks the ASX200 has endured at this time of year have been both regular and significant since the GFC:
- The average pullback from top to bottom is just over 10%.
- If we take out the 5 times the markets corrected over 10% the average is still almost 6%.
- So far, we’ve only corrected 1.9% from the May 6146 high, with a 6% pullback targeting ~5775.
As we often say statistics can be painted in lots of different ways but this is undoubtedly a dangerous period to be aggressively long stocks.
ASX200 Seasonality Chart
Potential targets for EOFY selling
The logical place to commence our investigation is to list the worst performing stocks in the ASX200 over the last 12-months. Eight companies stand out as having dropped by over 20% during this period, obviously the next 6-weeks may alter this list but it’s highly unlikely to become a totally fresh canvas.
- Domino’s Pizza (DMP) -27%.
- AMP Ltd (AMP) -21.2%.
- Perpetual (PPT) -25.1%.
- GrainCorp (GNC) -23.3%.
- QBE Insurance (QBE) -21.7%.
- Telstra (TLS) -38.7%.
- Aurizon (AZJ) -22.1%.
- AGL Energy (AGL) -20.4%.
Fund managers are often keen to lock in tax losses before June 30th and at the same time remove the “dogs” from their portfolio’s so they can start a new year with a portfolio which basically makes them feel better i.e. an EOFY spring clean! Hence 2 points worth considering:
- If you are considering selling one of the list it may be better to get in early.
- If you are considering bottom picking perhaps patience will be a virtue.
Our quick thoughts on these 8 companies who I’m sure would rather forget their last 12-months.
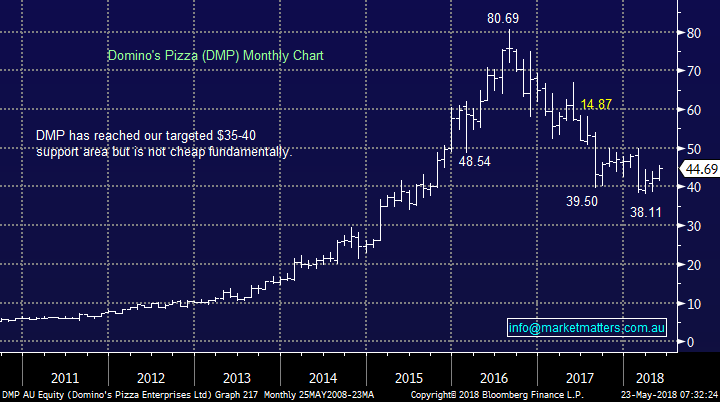
1 Domino’s Pizza (DMP) $44.69
DMP has gone from hero to villain in recent times after previously being a standout performer in the ASX200 since the GFC.
The company was trading on a very high valuation and when the rapid rate of growth subsided DMP was quickly re-rated, although we still believe its P/E is rich for the franchise owner. Wage pressure for the poorly paid workers remains a big issue plus more importantly most franchise owners are working huge hours to make a wage they probably could achieve elsewhere without the risks / capital outlay.
- We are not a fan of DMP and would turn negative if the current rally towards $50 continues.
NB we recently flagged DMP as trade for a 15% bounce to ~$50.
Domino’s Pizza (DMP) Chart
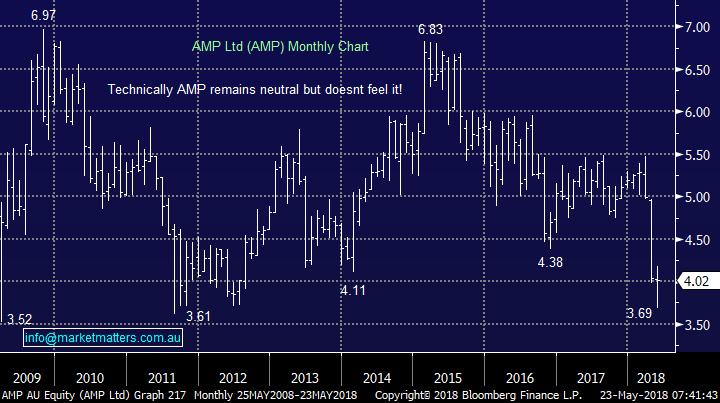
2 AMP Ltd (AMP) $4.02
AMP has been publicly savaged in the Hayne royal commission dropping the stock well over 15% since its March lows.
Over the last 24-hours we’ve seen a major US investment bank recommend accumulating AMP for long-term value – the stock bounced 1.5% yesterday in a very weak market.
The value depends on how well the evolving management team can negotiate disgruntled client retention.
- We are neutral AMP at current levels, not considering buying the stock but also recognising these are likely to prove unattractive levels to dump the stock.
AMP Ltd (AMP) Chart
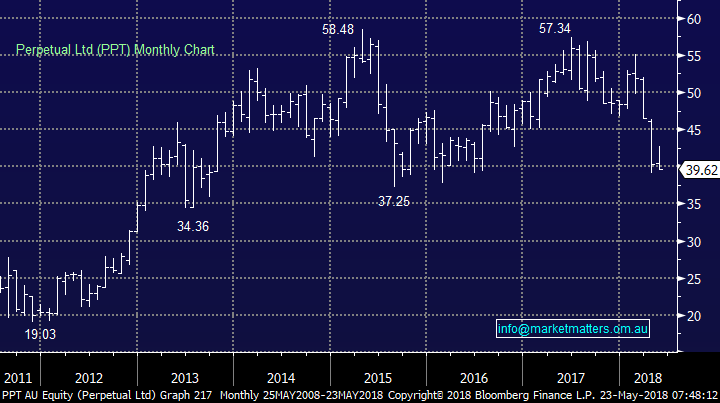
3 Perpetual (PPT) $39.62
PPT has fallen almost 30% since its February high above $55. The wealth manager has had a torrid few months like most of the sector however like AMP, the vertically integrated model of advice and product manufacturing / funds management has thrust the company into the spotlight for all the wrong reasons. The concern is that regulators will put in legislation that negatively impacts this sort of business model – an obvious risk for both AMP, PPT and others. The share price has broadly tracked that of AMP while perpetual has not suffered the same reputational damage.
- We would have interest in PPT if aggressive EOFY selling takes the stock down towards ~$36.
Perpetual (PPT) Chart
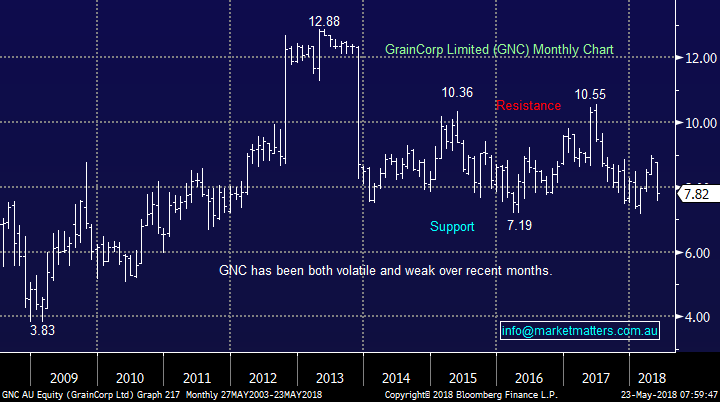
4 GrainCorp (GNC) $7.82
The agribusiness GNC which focuses on grain storage and transport is in part a weather play with their recent decline in net profit being attributed to continued dry weather conditions, damaging crop production and subsequent flow through earnings. Simply looking at a bar chart of earnings highlights how volatile these businesses are. Investing on the weather is clearly dangerous but it can produce opportunities for the short term orientated investor.
- We would have interest in GNC if it cops EOFY selling pushing the share price down the mid-$6 region.
GrainCorp (GNC) Chart
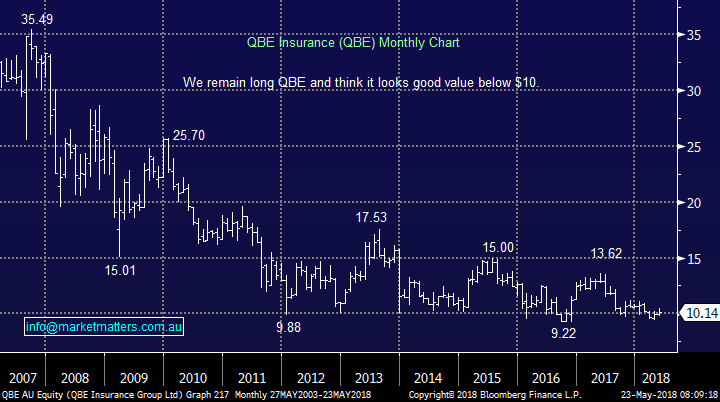
5 QBE Insurance (QBE) $10.14
We remain long QBE from around current levels but it’s been an extremely frustrating journey. Our logic was QBE appeared to have cleared the decks plus it’s about to receive tailwinds from rising US interest rates and a depreciating $A.
Our tailwind calls were smack on but QBE has again managed to pull another disappointment out of the hat, like a conjurer focused on upsetting its investors.
However, we believe the tailwinds have much further to go and signs are that new management are on the right track to change the company’s performance, bearing in mind many investors have totally lost faith in this business.
- We like QBE below $10 although it’s unlikely MM will average our position - tax loss selling may provide an opportunity for some.
QBE Insurance (QBE) Chart
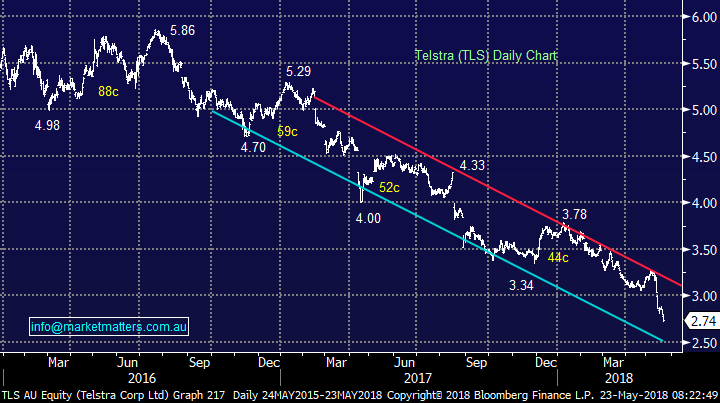
6 Telstra (TLS) $2.74
TLS has been flogged this year and while we are glad to have reduced our holding around $3.75 and to have not averaged ~$3.20 as planned we are clearly very disappointed to be still holding at this point in time. However we must look forward not back.
TLS has undoubtedly been a dividend trap for many investors but value is emerging in our opinion. Many brokers who have all turned bearish on the giant telco have cut their dividend forecasts to 22c, 20c and 14c over the next 3-years, that’s still a 5.1% fully franked yield in 3-years’ time albeit with plenty of capital risk!
We stick with our long-term view that TLS has become a stock for the active investor with attractive dividends on offer for the nimble – TLS will pay a 11c fully franked dividend in late August.
- We like TLS if it cops significant EOFY selling under $2.60 and MM will likely average our position here.
Telstra (TLS) Chart
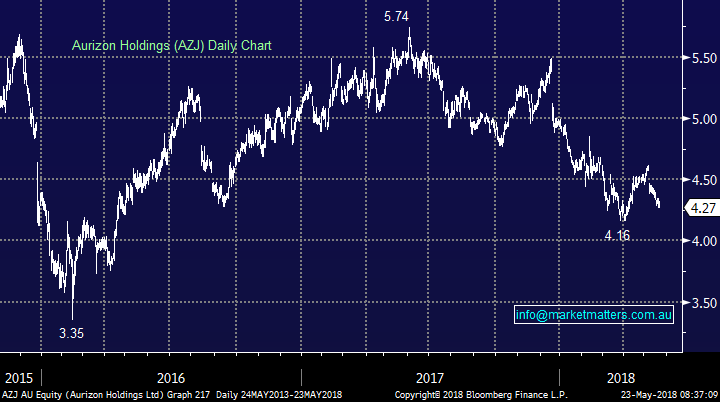
7 Aurizon (AZJ) $4.27
This rail freight company has certainly not enjoyed the last 12-months and a test of $4 feels inevitable in the coming weeks.
Aurizon has been in the press during 2018 because of QCA proposed restrictions on their maximum revenue between July 2017 and July 2021 which could see haulage capacity decrease by 10% despite strong conditions in the global coal industry.
The company is overall healthy reporting a half-year profit rise of over 50% in February, with management maintaining FY18 guidance for underlying EBIT in the range of $900 million to $960 million, however regulated pricing adds complexity.
- We like AZJ as an aggressive buy below $4 if the stock attracts EOFY selling.
Aurizon (AZJ) Chart
8 AGL Energy (AGL) $21.50
AGL is in the “yield play” basket that MM dislikes over the coming few years and the stock’s performance since early 2017 looks on track with our thoughts.
The companies trading on 13x 2019 earnings estimates which is reasonable although it was cheaper last month, like most of the market.
- We have no interest in the stock until well beneath $20 and are negative into strength above $23.
AGL Energy (AGL) Chart

Conclusion
Below are our conclusions with regard to these 8 stocks with potential EOFY selling looming:
1 MM like TLS, PPT, GNC and QBE into EOFY selling at levels discussed above and AZJ as a trading opportunity.
2 MM is neutral AMP.
3 MM negative AGL and DMP if they rally higher.
Overseas Indices
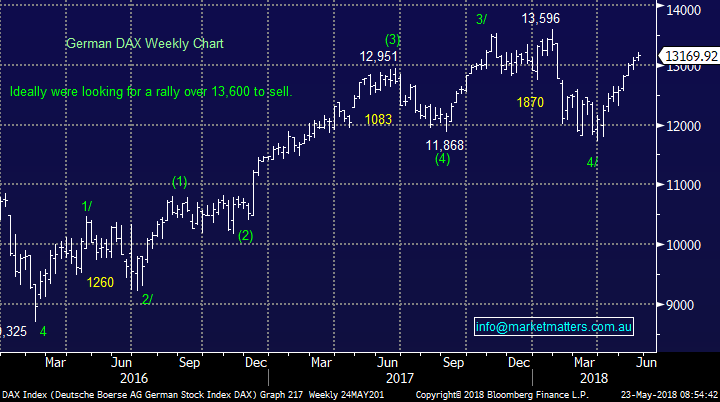
We remain mildly bullish overseas indices targeting fresh 2018 highs for many but we are mindful that we in May plus the UK FTSE has already reached MM’s new all-time high target.
German DAX Chart
The emerging markets which our resource stocks usually follow closely, although not so much recently, would look very interesting if they spike ~6% lower.
Emerging markets ETF Chart

Overnight Market Matters Wrap
· The US markets erased its day’s gains and more by the last hour of the session overnight, as uncertainty grows along with reignited trade concerns with China.
· Commodities were mixed with the oil price firmer at US$79.50/bbl, iron ore once again weaker at US$64.40/t, copper firmer and aluminium slightly weaker. Both BHP and RIO were trading slightly lower overnight.
· The June SPI Futures is indicating the ASX 200 to open marginally lower towards the 6035 level this morning.
Have a great day!
James & the Market Matters Team
Disclosure
Market Matters may hold stocks mentioned in this report. Subscribers can view a full list of holdings on the website by clicking here. Positions are updated each Friday, or after the session when positions are traded.
Disclaimer
All figures contained from sources believed to be accurate. Market Matters does not make any representation of warranty as to the accuracy of the figures and disclaims any liability resulting from any inaccuracy. Prices as at 23/05/2018. 8.31AM
Reports and other documents published on this website and email (‘Reports’) are authored by Market Matters and the reports represent the views of Market Matters. The MarketMatters Report is based on technical analysis of companies, commodities and the market in general. Technical analysis focuses on interpreting charts and other data to determine what the market sentiment about a particular financial product is, or will be. Unlike fundamental analysis, it does not involve a detailed review of the company’s financial position.
The Reports contain general, as opposed to personal, advice. That means they are prepared for multiple distributions without consideration of your investment objectives, financial situation and needs (‘Personal Circumstances’). Accordingly, any advice given is not a recommendation that a particular course of action is suitable for you and the advice is therefore not to be acted on as investment advice. You must assess whether or not any advice is appropriate for your Personal Circumstances before making any investment decisions. You can either make this assessment yourself, or if you require a personal recommendation, you can seek the assistance of a financial advisor. Market Matters or its author(s) accepts no responsibility for any losses or damages resulting from decisions made from or because of information within this publication. Investing and trading in financial products are always risky, so you should do your own research before buying or selling a financial product.
The Reports are published by Market Matters in good faith based on the facts known to it at the time of their preparation and do not purport to contain all relevant information with respect to the financial products to which they relate. Although the Reports are based on information obtained from sources believed to be reliable, Market Matters does not make any representation or warranty that they are accurate, complete or up to date and Market Matters accepts no obligation to correct or update the information or opinions in the Reports.
If you rely on a Report, you do so at your own risk. Any projections are estimates only and may not be realised in the future. Except to the extent that liability under any law cannot be excluded, Market Matters disclaims liability for all loss or damage arising as a result of any opinion, advice, recommendation, representation or information expressly or impliedly published in or in relation to this report notwithstanding any error or omission including negligence.
To unsubscribe. Click Here