What pockets of the resources sector does MM prefer in 2020 (WHC, GDX US, RIO, OZL, SFR, WSA, S32, AWC, FMG)
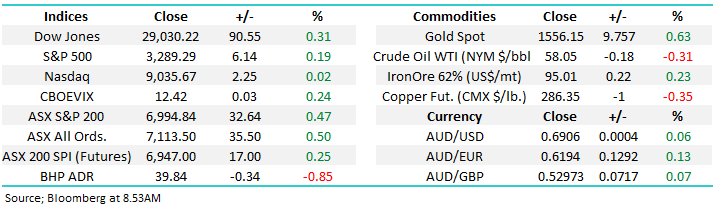
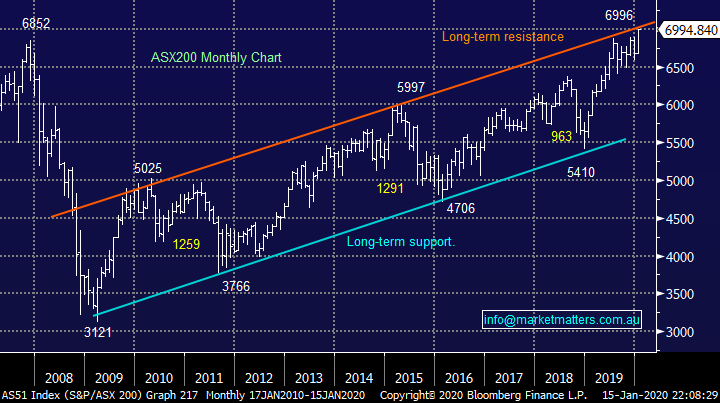
The ASX200 keeps steamrolling higher, we’re only in mid-January and the ASX200 is already up +312-points / 4.7% - people often like to quote “cash is king” well it certainly wasn’t in 2019 and it definitely hasn’t been in 2020 to-date! In 2019 the local index surged over 1000-points with most of the gains in Q1 and at this stage the trend clearly remains your friend, we see no reason to increase significantly our cash position at this point in time, the market will undoubtedly have a decent pullback at some stage but there are no imminent signs – remember even in 2019 we saw a 7% correction in August. Although the signing of the US-China trade deal would be a typical event to coincide with an interim market top.
Yesterday’s strength was focused in the mining services and gold stocks while iron ore and nickel struggled although importantly there were no real major areas of concern across the whole index. Following along from the differing performance across the resources space we decided to focus our attention today on where MM wants to be long in the sector into Q1 – remember MM is net bullish the reflation / resources trade.
Shaw’s CIO Martin Crabb, whom subscribers may know from a few videos / presentations I have done with him just returned from a global forum in Europe and one of the big consensus views was that inflation would remain benign in 2020, which implies investors are not set for any real uptick in prices despite a positive overall view on growth. I’ll try to do a quick video with Martin in the next week.
It’s also an interesting to think that while stocks continue to climb the steep valuation ladder bonds are treading water feeling unsure where interest rates are headed next, as we said yesterday this is a liquidity rally which makes putting a logical target on its potential extremely tough. Many economists are calling the RBA cash rate down from 0.75% to 0.25% this financial year and until this tailwind is removed from stocks (assets) or at least behind us it’s hard to imagine a meaningful pullback i.e. the last decent correction was 15% in 2018 just when bond yields started creeping higher.
MM believes 2020 will be a bullish but more choppy year where alpha (value) can be added to portfolios by active investors.
Overnight US stocks closed marginally higher but well off their highs, the SPI futures are pointing to the ASX200 cracking above 7000 early on today.
Today we’ve delved into the resources space where commodity rotation feels prevalent and we feel it’s the likely area we’ll transact in the months ahead, plus we’ve touched on some areas we largely ignored for most of 2019.
ASX200 Chart
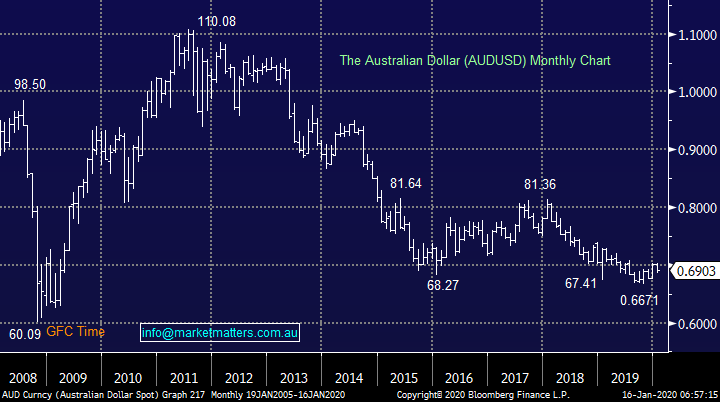
Similar to local bond yields the $A has been chopping around in a tight range for many months which is logical considering the significant influence on a currency by its domiciled interest rates. However, the local currency has fallen by ~10% since the US & China started the tariff trade war hence now this appears largely resolved we question whether it’s a matter of time before the $A powers back above the 70c region.
MM remains bullish the $A into 2020 / 2021 eventually targeting the 80c area.
Australian Dollar ($A) Chart
The US stock market also made fresh all-time highs overnight and we remind subscribers of our net bullish outlook for the market at least in Q1 of 2020
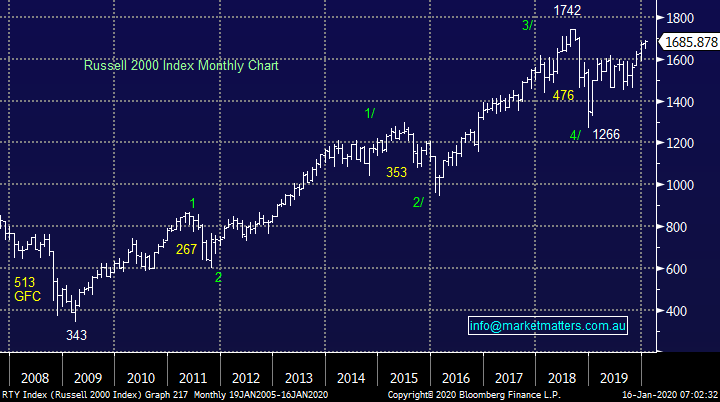
The Russell 2000 small cap index remains the clearest market to MM and we believe it’s in bullish catch up mode compared to its larger peers with an eventual target still ~6-8% higher. In other words, while US stocks may be in a very mature bull market selling weakness is fraught with danger, we feel it’s still time to sell excessive strength and remain buyers of weakness.
US Russell 2000 Index Chart
Coal
I feel a little uncomfortable writing about coal stocks following all the recent discussion on climate change as the horrendous bushfires continue to savage our land. This week the world’s largest fund manager Blackrock announced a policy blacklisting the coal sector, a move that’s around 6-months behind Norway’s decision to sell off ~$US8bn worth of fossil fuels from its sovereign wealth fund providing plenty of selling liquidity for the sector.
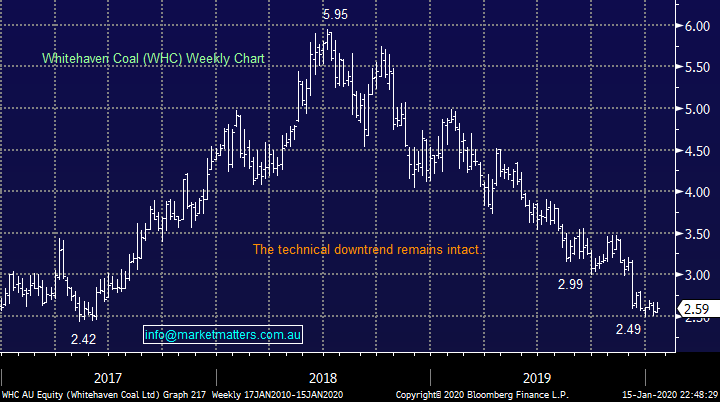
Due to their diversification the likes of BHP and Glencore look set to fly under the radar for now. Locally the big issues are for the likes of Whitehaven (WHC) and New Hope Coal (NHC) who’ve both endured a torrid time over recent years - it’s going to be hard for fund managers to explain losing money in a stock / sector which many investors dislike from an ethical perspective hence it’s easy to imagine many adopting an “if in doubt stay out” attitude.
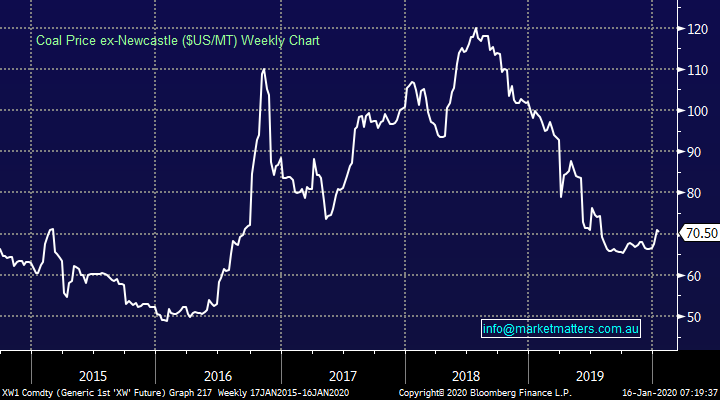
The style of announcement like Blackrock’s often creates a swing low in a stock / sector but in this case, we must recognise the strong possibility that this is the beginning of the end for coal. However, for those subscribers keen on the sector we would point out that the worm appears to have turned for the underlying commodity price since late 2019 which would usually imply the respective stocks would follow but in this case it feels all too hard to MM.
Incidentally, Whitehaven Coal (WHC) is out this morning with production numbers while the overhang from large shareholder Farrallon remains, the voluntary escrow that lasted for 60 days post the $300m sale of stock through UBS in November expired this week.
MM is neutral WHC / NHC at current levels.
Coal Price ex-Newcastle ($US/MT) Chart
Whitehaven Coal (WHC) Chart
Gold
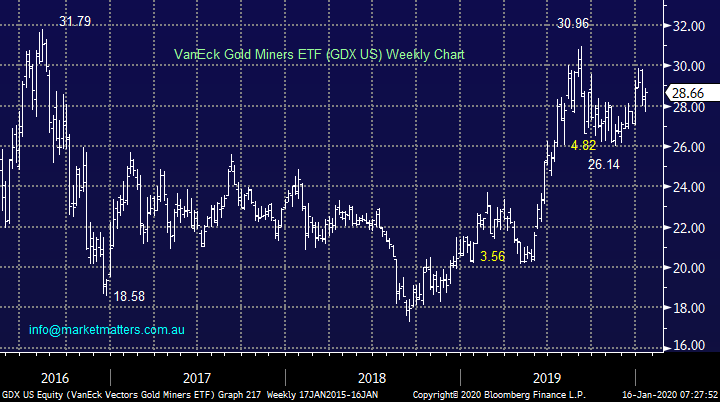
The gold sector has been a great illustration of how resource stocks can get ahead of their respective underlying commodities e.g. gold made fresh multi-year highs last week as the Iran news flashed across our screens yet Newcrest (NCM) remains almost 20% below its 2019 high and major gold ETF’s are ~7% their equivalent level.
At MM we pressed the buy button with Evolution (EVN) and Newcrest (NCM) too early last year underestimating to what degree they would underperform the precious metal. These positions might not yield the full potential we anticipated but they do feel set to rally nicely from current levels.
MM remains bullish the gold sector looking for at least another 10% upside.
VanEck Gold Miners ETF (GDX US) Chart
Diversified Miners
Obviously an important part of the Australian index with BHP, RIO and South32 leading from the front with MM long both BHP and RIO across both our Platinum & Income Portfolios - https://www.marketmatters.com.au/market-matters-portfolios/
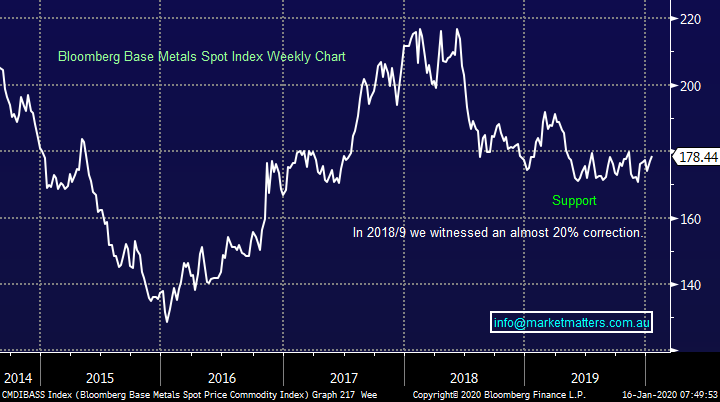
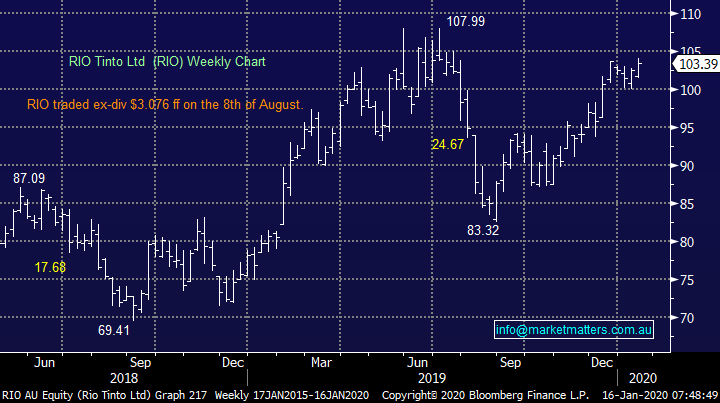
Overall MM remains bullish base metals looking for 8-10% upside but we are wary that the major miners have been “on a tear” for a while – remember the gold scenario when the local stocks got ahead of the underlying precious metals. However, BHP & RIO in particular have also become excellent yield plays over recent years hence at this stage we are only planning to take $$ into fresh all-time highs.
E.g. If / when RIO does break above $108, we will be considering taking some $$ from the table, especially as we are also long the highly correlated BHP Group (BHP).
MM remains bullish the diversified miners but the “easy $$” feels behind us.
Bloomberg Base Metals Spot Index Chart
RIO Tinto (RIO) Chart
Copper
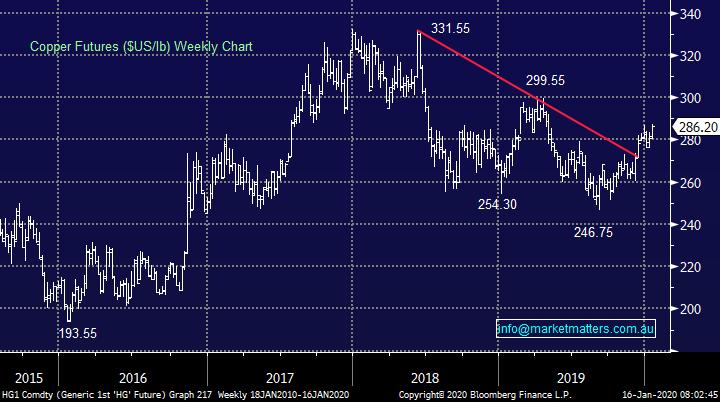
As we wrote a number of times in 2019, we like the stimulus trade which puts Copper front & centre – our initial target for this industrial metal is ~5% higher. As is usually the case the bottom for the sector happened before the good news of a trade resolution and as always, the top will probably be the same. I.e. when investors start asking, what next to drive prices.
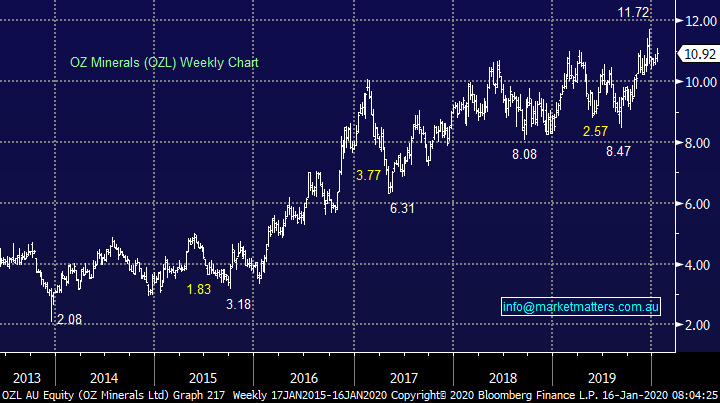
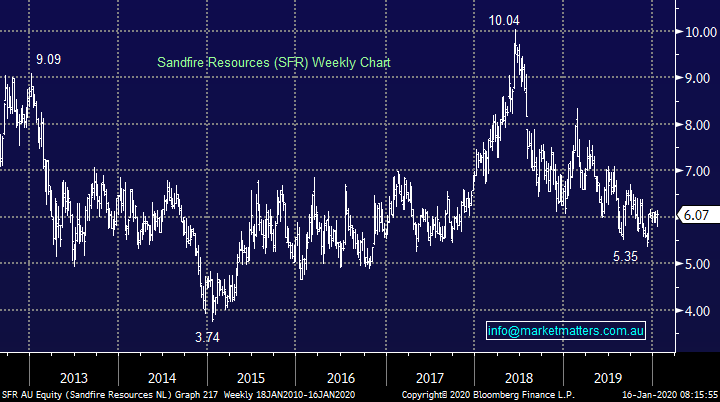
At this stage MM remains comfortable with our OZL position looking for a further 10% upside while the aggressive players might want to consider Sandfire Resources (SFR) where we now see excellent risk / reward from current levels. SFR is a more leveraged play in the sector and despite some operational issues last year, the market seems to be slowly becoming more comfortable here. The upcoming production report key.
MM remains bullish copper and its respective stocks.
Copper ($US/lb) Chart
OZ Minerals (OZL) Chart
Sandfire Resources (SFR) Chart
Nickel
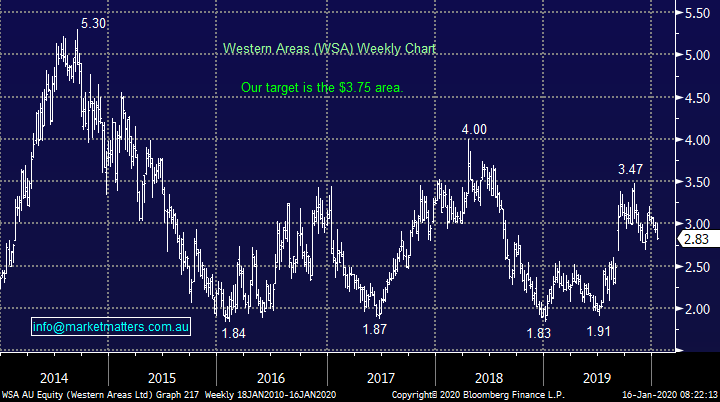
Another industrial metal that should enjoy the tailwind of global government stimulus in 2020 /21 hence an area of interest to MM. However, our favourite stock in the space Western Areas (WSA) has been volatile of late sitting almost 20% below its 2019 high but with volatility comes opportunity. MM is keen to increase our WSA position if we see further declines down towards $2.50.
MM remains bullish WSA looking for significant upside.
Western Areas (WSA) Chart
Manganese
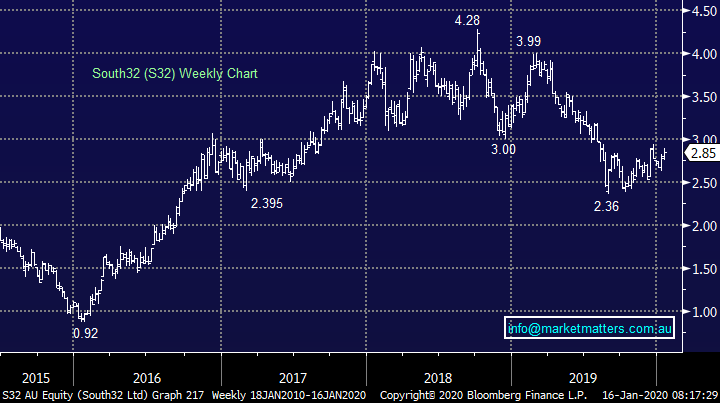
The dial looks to have almost bottomed for manganese bringing South32 onto the MM radar, at this stage we are happy to sit on or hands, but this is slowly becoming a potential candidate to switch into from BHP, or RIO.
S32 is out with production numbers this morning – more details to come on this.
MM is considering S32 below $3.
South32 (S32) Chart
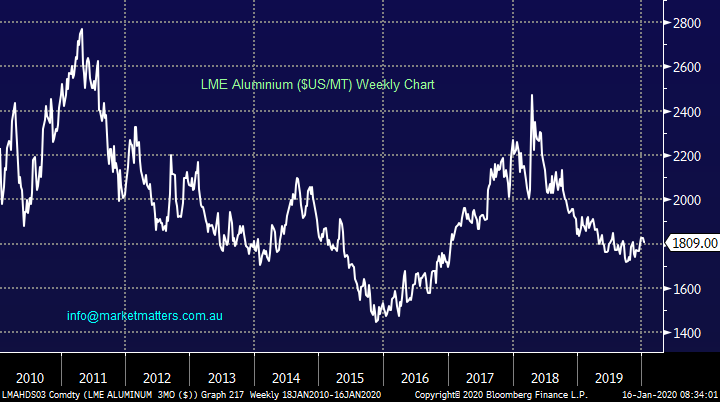
Aluminium
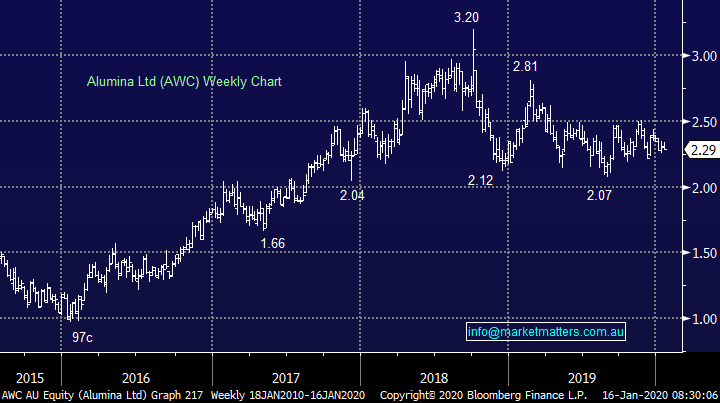
Australia’s major aluminium play Alumina (AWC) has tracked sideways since late 2018, we feel the risk / reward is not compelling for AWC which has ignored some of the base metals underlying weakness hence a “dummy spit” under $2 remains a possibility.
AWC is out with production numbers this morning – more details to come on this as well.
MM is neutral / negative AWC.
Aluminium ($US/MT) Chart
Alumina (AWC) Chart
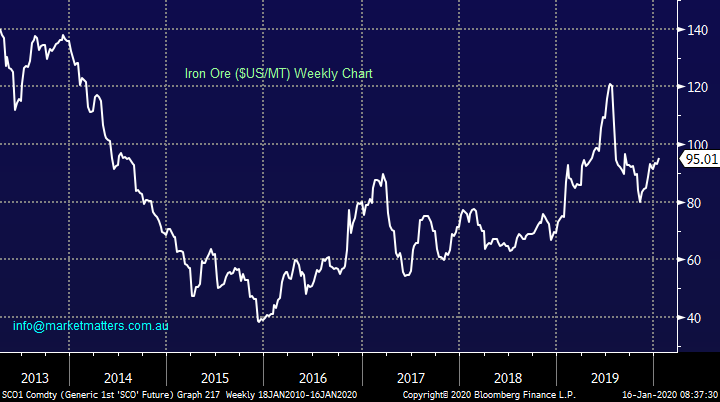
Iron Ore
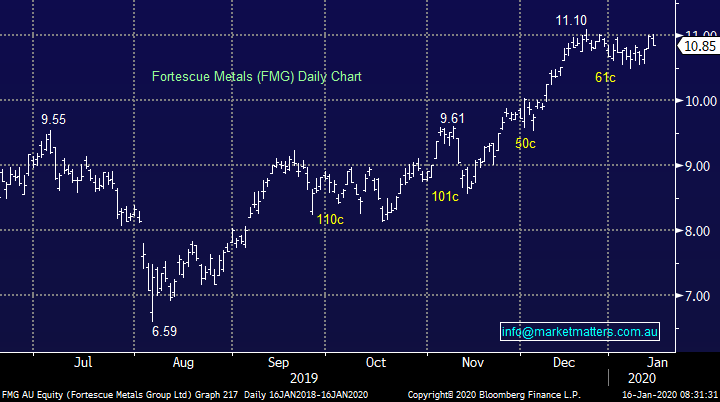
Iron Ore has bounced on the trade resolution dragging Fortescue Metals (FMG) in particular sharply higher, in our opinion having baked plenty of good news into the cake. Our preferred range for FMG in Q1 is $10.50 to $11.50 with a very attractive dividend looming next month. Although we took a great profit from FMG in 2019 it was too early in hindsight but at MM we have no problem buying back into a stock at higher price than we sold as long as it doesn’t become a habit! We can see iron ore / steel also benefitting from government stimulus hence we will consider buying weakness if it happens before they go ex-dividend.
Production numbers + earnings happening soon for the miner.
MM is considering FMG around $10.50.
Iron Ore ($US/MT) Chart
Fortescue Metals (FMG) Chart
Conclusion
We believe with the US-China trade resolution now behind us the “easy $$” has gone from the resource stocks in the short term and it’s time to play the cliché “buy low / sell high” in other words be prepared to take some $$ from the table when the elastic band gets stretched on the upside. Remain active in the sector is clearly our mantra at this point.
Overnight Market Matters Wrap
- The US equity indices ended their session at record highs yet again, with the ASX 200 to follow suit this morning as the quarterly earnings season gathers momentum and the US and China signed the long-awaited phase 1 of their trade deal.
-
Financial stocks, Bank of America, Goldman Sachs and PNC Financial all closed weaker, despite better than expected headline numbers, with only Black Rock rallying after they beat expectations. While only 30 S&P 500 companies have reported earnings, over 80% have beat revenue expectations according to FactSet. Consensus forecasts are for corporate earnings across the S&P500 to fall by 2% in the December quarter.
- BHP is expected to underperform the broader market after ending its US session off an equivalent of -0.85% from Australia’s previous close.
- The March SPI Futures is indicating the ASX 200 to open 19 points higher and expected to break the 7000 handle this morning on January Index Options Expiry.
Have a great day!
James & the Market Matters Team
Disclosure
Market Matters may hold stocks mentioned in this report. Subscribers can view a full list of holdings on the website by clicking here. Positions are updated each Friday, or after the session when positions are traded.
Disclaimer
All figures contained from sources believed to be accurate. All prices stated are based on the last close price at the time of writing unless otherwise noted. Market Matters does not make any representation of warranty as to the accuracy of the figures or prices and disclaims any liability resulting from any inaccuracy.
Reports and other documents published on this website and email (‘Reports’) are authored by Market Matters and the reports represent the views of Market Matters. The Market Matters Report is based on technical analysis of companies, commodities and the market in general. Technical analysis focuses on interpreting charts and other data to determine what the market sentiment about a particular financial product is or will be. Unlike fundamental analysis, it does not involve a detailed review of the company’s financial position.
The Reports contain general, as opposed to personal, advice. That means they are prepared for multiple distributions without consideration of your investment objectives, financial situation and needs (‘Personal Circumstances’). Accordingly, any advice given is not a recommendation that a particular course of action is suitable for you and the advice is therefore not to be acted on as investment advice. You must assess whether or not any advice is appropriate for your Personal Circumstances before making any investment decisions. You can either make this assessment yourself, or if you require a personal recommendation, you can seek the assistance of a financial advisor. Market Matters or its author(s) accepts no responsibility for any losses or damages resulting from decisions made from or because of information within this publication. Investing and trading in financial products are always risky, so you should do your own research before buying or selling a financial product.
The Reports are published by Market Matters in good faith based on the facts known to it at the time of their preparation and do not purport to contain all relevant information with respect to the financial products to which they relate. Although the Reports are based on information obtained from sources believed to be reliable, Market Matters does not make any representation or warranty that they are accurate, complete or up to date and Market Matters accepts no obligation to correct or update the information or opinions in the Reports. Market Matters may publish content sourced from external content providers.
If you rely on a Report, you do so at your own risk. Past performance is not an indication of future performance. Any projections are estimates only and may not be realised in the future. Except to the extent that liability under any law cannot be excluded, Market Matters disclaims liability for all loss or damage arising as a result of any opinion, advice, recommendation, representation or information expressly or impliedly published in or in relation to this report notwithstanding any error or omission including negligence.


