Subscribers questions (ANZ, PFP, IVC, CBA, CIA, DCG, XARO, ALK)

The ASX200 attempted to rally strongly early last week only to fail as has been the underlying market theme for almost 20-weeks i.e. choppy random price action between 6396 and 6875. On a couple of occasions we’ve felt the market was poised to breakout of this congestion pattern only for the magnet around the 6650 level to draw the market back, its clearly time to wait for the market to provide a clear signal, second guessing has become simply too hard.
Over the weekend we had no fresh market sensitive news just a continuation of a couple of recent stories:
1 – Boris Johnson’s BREXIT deal got knocked back by the House of Parliament as this embarrassing debacle received another “kick in the guts”, we still feel he will get his deal over the line but UK facing stocks are likely to struggle this morning.
2 – The Australian housing market enjoyed another solid week on the auction front with the preliminary clearance rate coming in above 80% as buyers appear keen to get set before Christmas – yes that time of year is approaching fast!
We love our property market in Australia and if the RBA is going to help maintain mortgage rates around 3% it feels like this pivotal part of our economy may have seen its worst – at MM while we see little upside from current levels a period of stability is our preferred option although some pockets of awful performance from apartments where there’s over supply looks inevitable.
No change, MM remains comfortable being relatively defensive at this point in time.
On Saturday morning the SPI futures were pointing for the ASX200 to open down 15-points following a -0.4% pullback by the S&P500 - we might be waiting a few more days yet for this market to show any clear direction.
Thanks for the questions as always, again a few unusual ones plus the core focus on dividend yield which makes sense for investors who are finding todays term deposits paying ~1.5% very unpalatable.
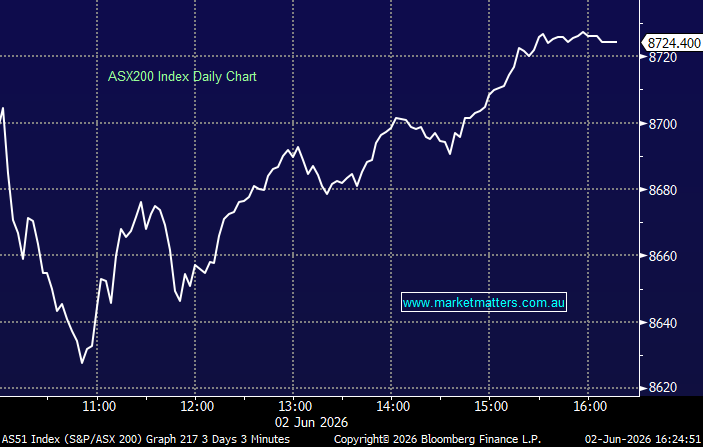
ASX200 Index Chart
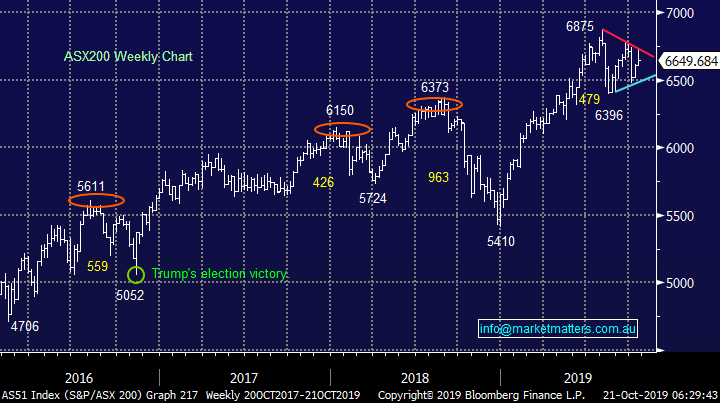
Like our own market US stocks continue to trade in a very choppy manner, last week they again registered small gains - a close under 2950 will generate short-term sell signals for MM in the S&P500 cash.
While our preferred scenario remains US stocks will correct in the coming weeks I reiterate there are no sell signals in play, it’s more of an ongoing “Gut Feel” at this stage.
US S&P500 Index Chart

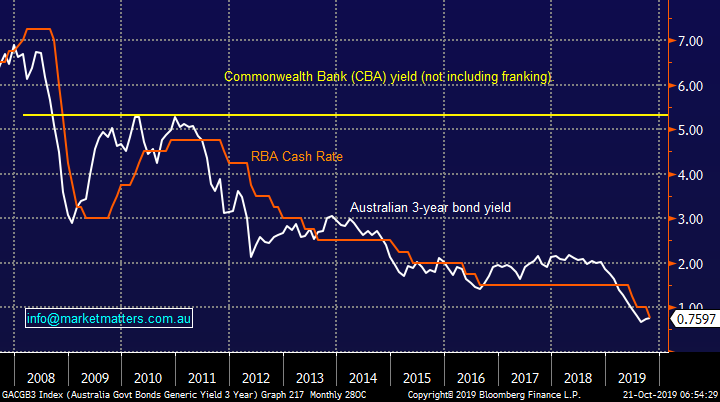
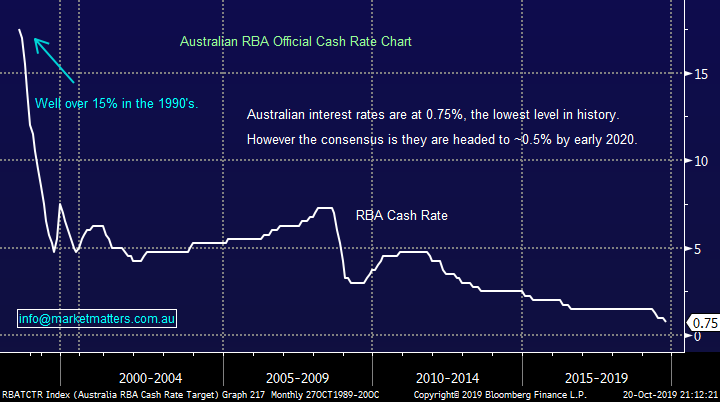
The world is witnessing the lowest interest rate environment in history with negative yields in both Europe & Japan while the RBA has already slashed our own Official Cash Rate to 0.75%, now a lot closer to zero than 2%!
The dichotomy that negative bond yields is throwing up to the investment community is both fascinating and tricky e.g. a quality company making money and holding excess cash is being penalised in some parts of the world (hence buybacks) while companies that are geared up with mountains of debt, usually a huge red flag, are being rewarded by the economic back drop. At MM we believe its time to “KISS” (keep it simple stupid) and judge businesses on their quality / value but if they are too expensive be patient e.g. how we perceive CSL Ltd around $250.
MM believes local rates are reaching the nadir on the downside.
Major Australian Interest Rates Chart
Question 1
“Hi Market Matters Team, I just wonder if it is still good to buy ANZ share at the current price, I have missed the low spot last week but considering it will do ex dividend next month I just want to ask the question. Also do you when is the next scheduled US-China talk :-) the 'deal' from first round of talk was a surprise to me, I held back from buying banks or resource shares last week expecting there would be no deal, I actually bought more gold stocks preparing for the worst but I think I was 1 step (or a week too early). My thoughts are US-China would never achieve anything and gold will be king. Please shed some lights, I'm not too sure what to do now” - Many thanks Tong N, keep smiling!
Morning Tony,
Firstly I love your email sign off “keep smiling!”, it did just that and put a smile on my face.
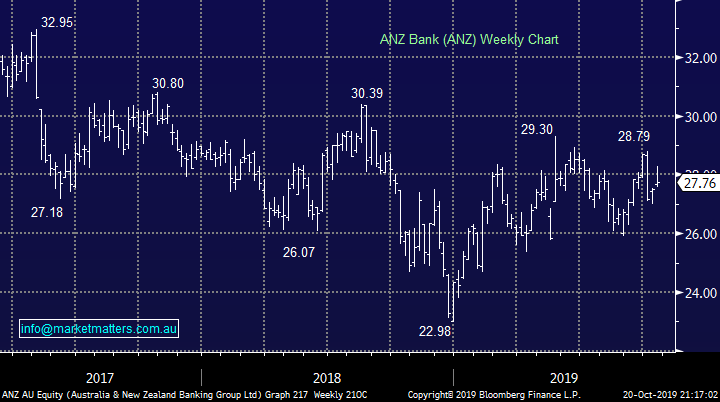
ANZ Bank (ANZ) like the whole sector and market has started to chop around over recent weeks but we still believe its ~5.8% fully franked yield is sustainable making the stock attractive compared to term deposits. For investors who buy the stock today and hold it for 13-months, gaining access to 3 dividends in the process, the yield will be closer to 8% pa fully franked, sounds easy but of course there’s always the risk of capital depreciation i.e. The stock falls in price.
We are comfortable with our bank holdings at current levels and aren’t considering tweaking in either direction at this stage for the MM Portfolios.
We still feel the banks represent solid value today.
ANZ Bank (ANZ) Chart
Question 2
“Subscriber question for next week. What is your thoughts on PFP?” – Cliff G.
Hi Cliff,
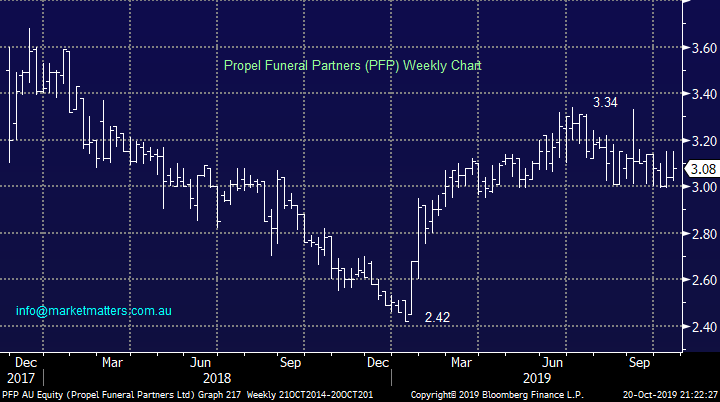
Propel Funeral Partners (PFP) is as it sounds a funeral services business based in Sydney, it currently has a market cap in excess of $300m. For those unfamiliar with this relatively new listing to the boards the stock yields ~3.8% fully franked.
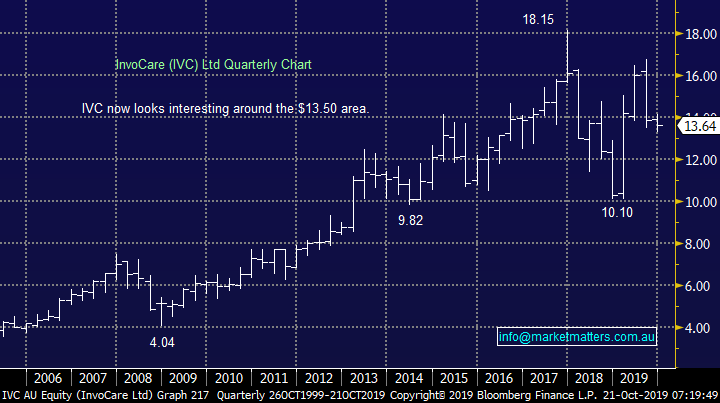
Like major rival Invocare (IVC) its exposed to the tailwind of an ageing population which is expected to grow by almost 1.5% over the next decade. PFP is trading on an Est P/E for 2020 of 19.9x compared to IVC at 27.8x for 2019, which also yields just under 4%. MM likes both of these businesses as quasi yield plays but we do believe there’s better opportunities out there with neither on our radar at this point in time.
MM is neutral to positive PFP.
Propel Funeral Partners (PFP) Chart
InvoCare (IVC) Chart
Question 3
“You mentioned you did a review recently of Lic's and Lit's I did miss reading it. Could you please resend? Do you make recommendations on purchase of these?” - Regards Jim F
“Last week James gave a top analysis of LICs. On the basis of his presentation I decided to sell WAM which is showing a 36% capital gain in our portfolio. However, as it is paying a 6.7% fully franked dividend, my second thought was maybe not. While WAM is definitely not a buy, would MM consider it as a hold considering the dividend?” – Thanks Chris G.
“James, thank you for the article linked in your email regarding listed income investments. I found it very informative and certainly a good alternative to term deposits. The analysis could be improved by adding whether dividends are paid quarterly or monthly. For a self-funded retiree the monthly dividend model is very attractive to me. But a question. Why are these dividends for all I examined without franking credits. I don't understand this as income is earned in Australia. Please advise” - thanks David L.
Hi Guys,
We covered these is two recent reports, a video covering mainly listed investments companies (LICs) available here, and this was driven by subscriber questions while we also discussed mainly listed investment trusts (LITs) with an income focus in last weeks income note, available here
RE WAM: I struggle to buy something trading at premium to NTA, so if I wouldn’t buy it, I’m more on the sell side despite the yield being attractive. Just in terms of yield for WAM, also important to recognise that at times they will eat into actual capital to maintain that yield rather than simply just passing through dividends accrued from their underlying holdings – something that is not widely understood.
RE franking credits. No franking credits as those funds are structured as a listed investment trust not a listed investment company, meaning that the income is simply passed through to the trustee before tax is paid, whereas a listed investment company pays company tax and passes through the franking credits that relate to that tax to the share holder.
Australian RBA Cash Rate Chart
Question 4
"Hi James, I know that you have commented on Bank Hybrids in past newsletters so I am interested to have you thoughts on the latest Commonwealth Bank Pearls XII Capital Notes offer with its relatively low 3% margin. Love your work always engaging." Cheers, Gary
“Hi Team, I am planning on taking up PERLS Xii, the offer price is $100/unit where the underlying CBA price is c.$80/unit. Earlier on in the year i bought MQGPD where the price was $100/unit but the underlying MQG price was c.$130/unit. This might be a daft question, but is the underlying company price irrelevant?” – Nick R.
Hi guys,
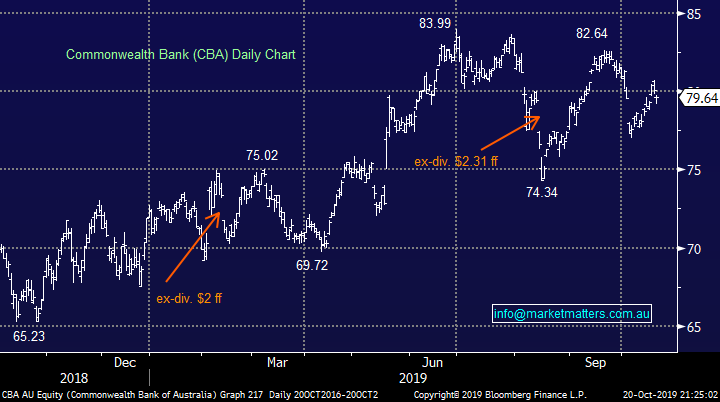
Firstly Gary, the yield is low relative to history, at 3% over bank bills it’s just 20bp above the CBAPD that really hurt the hybrid market a few years ago. I’m lukewarm on the deal, it looks attractive relative to the current market but in absolute terms, I’m okay with it but not ‘filling my boots’. I do think bank hybrid’s have become safer given the higher capital requirements now applied to banks so spreads should be lower plus the demand across our desk was very high in the deal meaning there was large scale back of bids which implies the secondary market will be well supported. We covered it in more depth in the income note – CLICK HERE
Hi Nick, no such thing as a daft question, please always ask, we’re happy to answer. There Is no relationship between share price and hybrid security in the way you are asking. Hybrids do have a share price trigger in them that does come into play in extreme events however in the context of your question, the price of CBA at $80 and the hybrid at $100 will not have a bearing on performance.
Commonwealth Bank (CBA) Chart
Question 5
“Hi, what are your thoughts on CIA & DCG?” – David H.
Morning David,
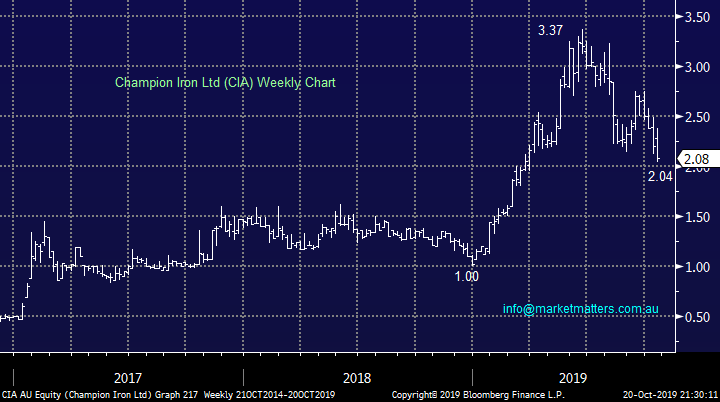
I believe these are 2 new companies to the MM question report in 2019, thanks as we always like going out of comfort zone. Dual-listed Canadian iron ore miner (CIA) now has a market cap over $900m, its share price has been following the underlying bulk commodity price closely in 2019 - just like Fortescue Metals (FMG).
We prefer FMG over CIA, especially if Twiggy Forests stock is sold off today on the native title news from late last week ,which is pointing to a large claim on FMG, not fresh news but a negative twist in the tail.
MM prefers FMG over CIA.
Champion Iron Ltd (CIA) Chart
Mining services business Decmil Group (DCG) has clearly endured a tough few years with its share price tumbling. The stock now yields 4.8% fully franked but the capital decline clearly has more than offset this over the last few years.
Technically we could buy DCG with stops below 77c but its an aggressive play that’s not for us.
MM is neutral DCG.
Decmil Group (DCG) Chart

Question 6
“Sorry to be so dumb but what do you regard as cyclical s apart from resources?” Marvin C.
Hi Marvin,
No such thing as a dumb question except the one which isn’t asked!
A cyclical stock is one which benefits from economic growth but struggles if we have contraction / slowing growth. Recently we’ve seen profit downgrades from cyclicals like Nick Scali (NCK) and Southern Cross Media (SXL) which suggests the RBA’s optimism on the Australian economy is wrong or premature. Our view at MM is global central banks are loading the cannons for some major fiscal stimulus to support the already extremely accommodative monetary policy (low rates) and its this stimulus which will provide a much needed shot in the arm for some cyclical stocks / sectors. At this stage things look pretty bleak for the group but it always does at the bottom!
Many professionals will argue that most market sectors are cyclical to varying degrees with the exception of the Utilities and “yield play” names, we would add Healthcare, Telcos and IT stocks to that list. Hence to MM the cyclicals also includes the banks and Consumer Services but its important to remember we consider each stock on its individual merit.
Question 7
“What are the factors that affect price change for XARO ?” - Thanks Mike C.
Hi Mike,
A very good question and not as simple as it might imply. Firstly, the XARO invests in an existing fund and mirrors the performance of the fund. That fund started on the 20th July 2012 and has the following performance metrics.
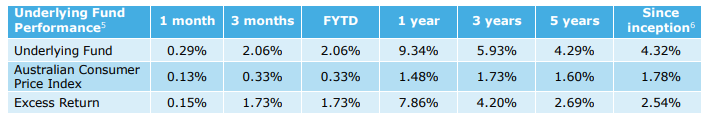
Clearly, the performance over 1 year is exceptional (for bonds) and that’s been a function of money going into bonds, pushing prices up and yields down, which has driven this performance, so, just like a share it is demand that drives the price and ultimately the return. However, as markets become tougher, which is likely to be the case in bonds, then good active management will be important in our view, and we think the guys that run XARO are good active managers of this specific bond strategy.
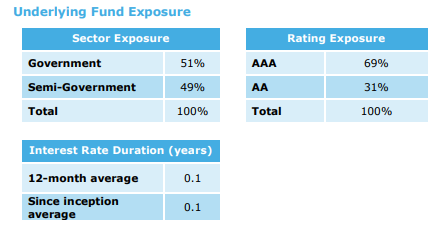
We’ve written a lot recently about our concern for bond like equities, and traditional yield play stocks given the potential bottoming in rates. That is the reason (in our income portfolio) we are heavily skewed to floating rate notes (hybrids) or funds that are floating, while the XARO is a very actively managed fund with really no duration risk. The simplest way to think about duration is that investors tend to buy longer dated securities to get higher yield when rates are low. They tend to say, we need 5% and we can get that by buying longer dated securities, however by buying longer dated securities you have exposure to greater risks given there is more time for things to change. One of the reasons why we like the XARO at this point in the cycle as it has really no duration risk across its book so the risk there is low, while they hold Government & Semi Government Debt, which are bonds offered by states and territory governments and trades them for relative value on the long and short side.
ActiveX Area Real Outcome Bond Fund (XARO) Chart

Question 8
“Hi, I’m a subscriber and find the information you provide very ‘real’ I follow most of your recommendations after doing a little research of my own, but I also have what I call my defensive investment portfolio which consists entirely of ETF’s spread over Vanguard, Ishares, Statestreet. I have exposure to Aust Shares, Int shares (now hedged due to your thoughts on AUD), property, Bonds, and some sector specific ETFs. There is a general consensus that passive investment ETFs are causing a bubble - the fact that they have to buy certain stocks because they are in an index, is causing some shares to be overvalued. Could you comment in one of your reports or if you have recently and I missed it, tell me which report it was in.” Thanks Russell E.
Hi Russell,
Thanks for the positive feedback, much appreciated.
Overall I’m not a believer that ETF’s are causing a bubble, there’s no great difference between owning a diversified Australian portfolio and an ETF which reflects the ASX200 index but there 2 obvious ways we do see bubbles forming just as they have in the past:
1 – If we see excessive leverage into a market or sector, we believe this has been occurring with the Australian growth sector which has recently led to declines in the likes of Wisetech (WTC) -12% and Afterpay (APT) -15%, stocks cannot withstand bad news if everyone’s already long.
2 – If we see investors pouring to much $$ into one area / market perceiving it to be safe e.g. we believe the $A will strengthen towards 80c from today’s level and Australian retail investors have piled into US equity funds due to superior returns in the past. They will lose performance if the $A does indeed rally.
MSCI Global World Index (MXWO) Chart

Question 9
“Hi James and Team, thanks for all your helpful insights. It has improved my investment performance. One stock that I own and like is ALK. Not one you cover but one that has performed strongly in recent weeks. Whilst they have a big project involving rare earths they are primarily a gold stock at the moment it seems and have been enjoying that ride plus a new discovery. What do you think from a technical perspective? It looks to be just climbing higher so not sure when to take profits. I would appreciate any insights you may have.“ - Cheers & Kind Regards, Peter H.
Hi Peter,
Thanks for again for the positive feedback, our objective is to help investors navigate the constantly evolving financial landscape and its very rewarding to hear we are achieving some success.
Rare earths company Alkane Resources (ALK) is not a stock we follow closely but it’s certainly enjoyed a great few months taking the companies market cap to $417m.
Similar to rival Lynas (LYC) this relative small cap is a volatile beast and as such we would be using technical levels to trade or invest from a risk / reward perspective. Technically we can see a pullback towards 68-70c but stops on longs would need to be sub 45c which is scary from a % point of view.
MM is neutral ALK expecting a pullback before another assault on $1.
Alkane Resources (ALK) Chart

Overnight Market Matters Wrap
- With the US-China trade negotiations looking back on track, concerns turned back to global growth concerns, leading the US equity markets back in the red sea.
- Crude oil is certainly part of the domino effect with global growth, ending its session lower, currently at US$53.78/bbl. directing weakness to be seen in the emerging markets and our resource names today.
- Across in the Euro region, British PM, Johnson is back on the attack to have this BREXIT deal sorted, while claims an extension was requested with the EU.
- The December SPI Futures is indicating the ASX 200 to open 20 points lower, testing the 6630 level this morning.
Have a great day!
James & the Market Matters Team
Disclosure
Market Matters may hold stocks mentioned in this report. Subscribers can view a full list of holdings on the website by clicking here. Positions are updated each Friday, or after the session when positions are traded.
Disclaimer
All figures contained from sources believed to be accurate. All prices stated are based on the last close price at the time of writing unless otherwise noted. Market Matters does not make any representation of warranty as to the accuracy of the figures or prices and disclaims any liability resulting from any inaccuracy.
Reports and other documents published on this website and email (‘Reports’) are authored by Market Matters and the reports represent the views of Market Matters. The Market Matters Report is based on technical analysis of companies, commodities and the market in general. Technical analysis focuses on interpreting charts and other data to determine what the market sentiment about a particular financial product is, or will be. Unlike fundamental analysis, it does not involve a detailed review of the company’s financial position.
The Reports contain general, as opposed to personal, advice. That means they are prepared for multiple distributions without consideration of your investment objectives, financial situation and needs (‘Personal Circumstances’). Accordingly, any advice given is not a recommendation that a particular course of action is suitable for you and the advice is therefore not to be acted on as investment advice. You must assess whether or not any advice is appropriate for your Personal Circumstances before making any investment decisions. You can either make this assessment yourself, or if you require a personal recommendation, you can seek the assistance of a financial advisor. Market Matters or its author(s) accepts no responsibility for any losses or damages resulting from decisions made from or because of information within this publication. Investing and trading in financial products are always risky, so you should do your own research before buying or selling a financial product.
The Reports are published by Market Matters in good faith based on the facts known to it at the time of their preparation and do not purport to contain all relevant information with respect to the financial products to which they relate. Although the Reports are based on information obtained from sources believed to be reliable, Market Matters does not make any representation or warranty that they are accurate, complete or up to date and Market Matters accepts no obligation to correct or update the information or opinions in the Reports. Market Matters may publish content sourced from external content providers.
If you rely on a Report, you do so at your own risk. Past performance is not an indication of future performance. Any projections are estimates only and may not be realised in the future. Except to the extent that liability under any law cannot be excluded, Market Matters disclaims liability for all loss or damage arising as a result of any opinion, advice, recommendation, representation or information expressly or impliedly published in or in relation to this report notwithstanding any error or omission including negligence.